- Consumption And Savings Functions Disposable Consumption Income 0 100 400 200 Math It Graph It Write It Saving 50 0 A 1 (47.05 KiB) Viewed 38 times

- Consumption And Savings Functions Disposable Consumption Income 0 100 400 200 Math It Graph It Write It Saving 50 0 A 2 (35.36 KiB) Viewed 38 times
- Consumption And Savings Functions Disposable Consumption Income 0 100 400 200 Math It Graph It Write It Saving 50 0 A 3 (35.36 KiB) Viewed 38 times
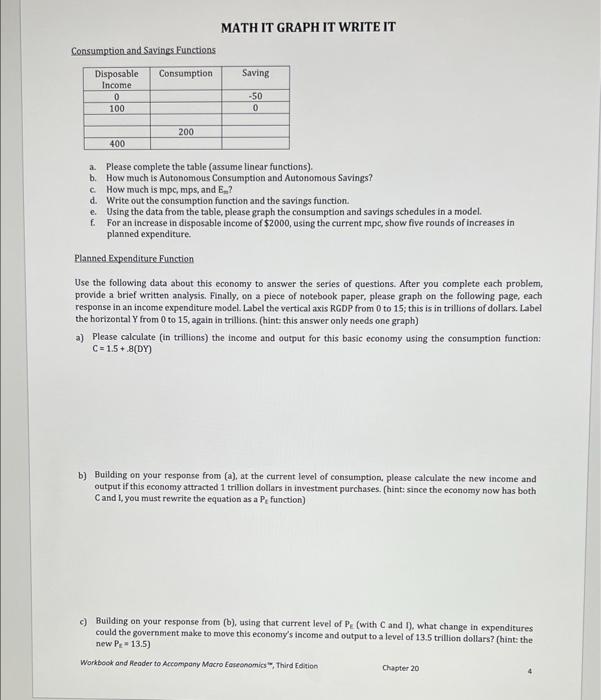
Consumption and Savings Functions Disposable Consumption Income 0 100 400 200 MATH IT GRAPH IT WRITE IT Saving -50 0 a. Please complete the table (assume linear functions). b. How much is Autonomous Consumption and Autonomous Savings? с How much is mpc, mps, and E? d. e. f. Write out the consumption function and the savings function. Using the data from the table, please graph the consumption and savings schedules in a model. For an increase in disposable income of $2000, using the current mpc, show five rounds of increases in planned expenditure. Planned Expenditure Function Use the following data about this economy to answer the series of
questions. After you complete each problem, provide a brief written analysis. Finally, on a piece of notebook paper, please graph on the following page, each response in an income expenditure model. Label the vertical axis RGDP from 0 to 15; this is in trillions of dollars. Label the horizontal Y from 0 to 15, again in trillions. (hint: this answer only needs one graph) a) Please calculate (in trillions) the income and output for this basic economy using the consumption function: C= 1.5+ 8(DY) b) Building on your response from (a), at the current level of consumption, please calculate the new income and output if this economy attracted 1 trillion dollars in investment purchases. (hint: since the economy now has both Cand I, you must rewrite the equation as a P, function) c) Building on your response from (b), using that current level of Pe (with C and I), what change in expenditures could the government make to move this economy's income and output to a level of 13.5 trillion dollars? (hint: the new P = 13.5) Workbook and Reader to Accompany Macro Easeonomics", Third Edition Chapter 20
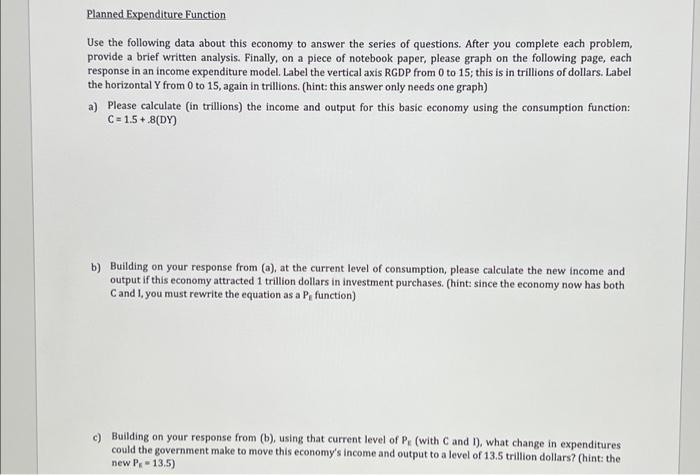
Planned Expenditure Function Use the following data about this economy to answer the series of
questions. After you complete each problem, provide a brief written analysis. Finally, on a piece of notebook paper, please graph on the following page, each response in an income expenditure model. Label the vertical axis RGDP from 0 to 15; this is in trillions of dollars. Label the horizontal Y from 0 to 15, again in trillions. (hint: this answer only needs one graph) a) Please calculate (in trillions) the income and output for this basic economy using the consumption function: C= 1.5+ 8(DY) b) Building on your response from (a), at the current level of consumption, please calculate the new income and output if this economy attracted 1 trillion dollars in investment purchases. (hint: since the economy now has both C and I, you must rewrite the equation as a P, function) c) Building on your response from (b), using that current level of Pe (with C and 1), what change in expenditures could the government make to move this economy's income and output to a level of 13.5 trillion dollars? (hint: the new P-13.5)