Page 1 of 1
Plot (using MATLAB) or draw the time domain response of the uncontrolled open loop system response to an exponential inp
Posted: Tue Jun 07, 2022 3:46 pm
by answerhappygod
- Plot Using Matlab Or Draw The Time Domain Response Of The Uncontrolled Open Loop System Response To An Exponential Inp 1 (83.37 KiB) Viewed 50 times
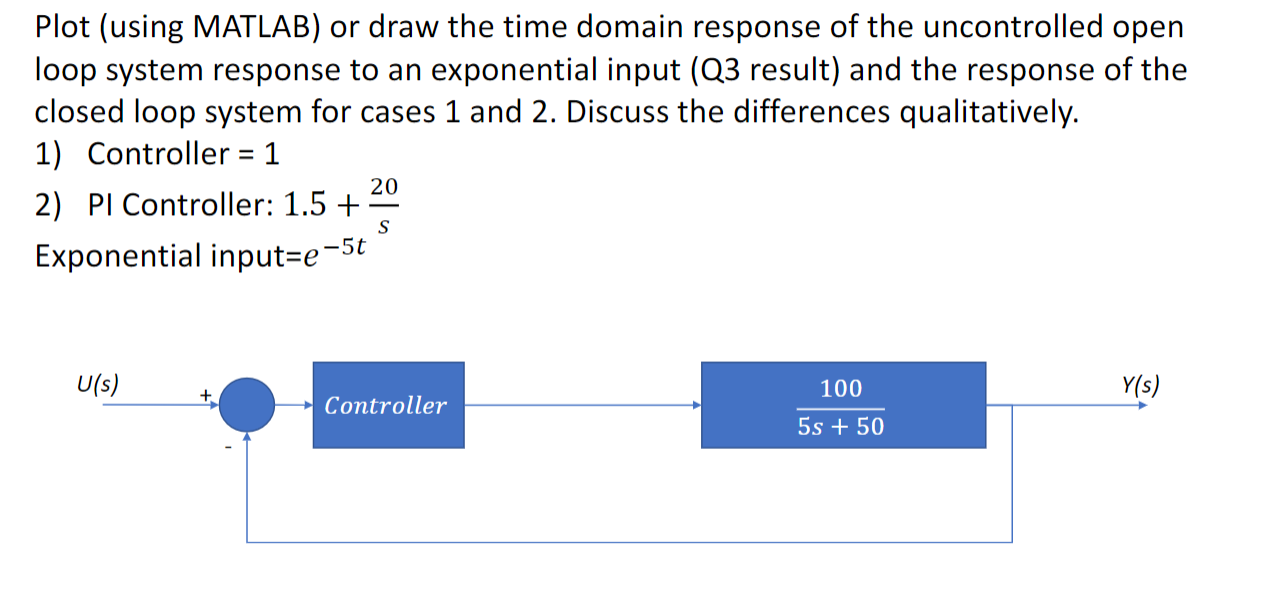
Plot (using MATLAB) or draw the time domain response of the uncontrolled open loop system response to an exponential input (Q3 result) and the response of the closed loop system for cases 1 and 2. Discuss the differences qualitatively. 1) Controller = 1 20 2) PI Controller: 1.5 + S Exponential input-e-5t U(s) Y(s) 100 5s + 50 Controller