- Use Matlab For Graph Practice 1 To 10 And Then Do 11 To 14 As Assignment And Submit Your Work 1 Plot Command To Gene 1 (50.8 KiB) Viewed 40 times
- Use Matlab For Graph Practice 1 To 10 And Then Do 11 To 14 As Assignment And Submit Your Work 1 Plot Command To Gene 2 (29.83 KiB) Viewed 40 times
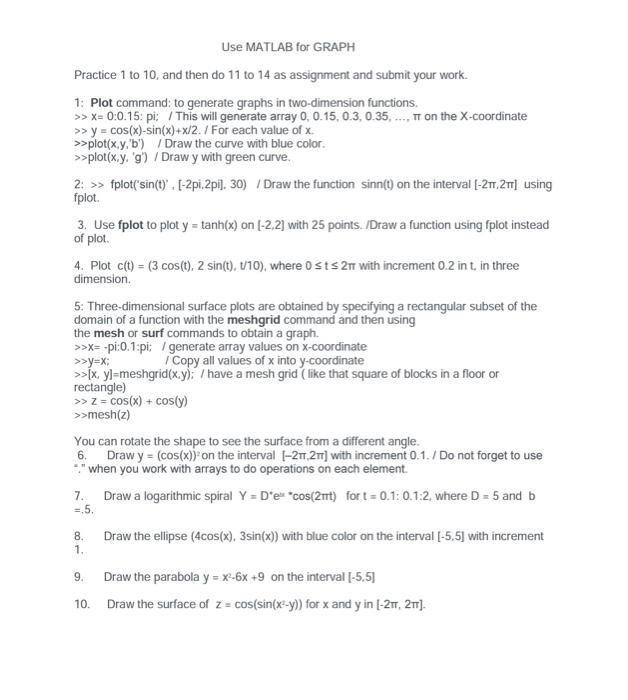
Use MATLAB for GRAPH Practice 1 to 10, and then do 11 to 14 as assignment and submit your work. 1: Plot command: to generate graphs in two-dimension functions. >> x= 0:0.15: pi; / This will generate array 0, 0.15, 0.3, 0.35, TT on the X-coordinate >> y = cos(x)-sin(x)+x/2. / For each value of x. >>plot(x,y,'b') /Draw the curve with blue color. >>plot(x.y. 'g') /Draw y with green curve. 2: >> fplot('sin(t)'. [-2pi.2pi], 30) /Draw the function sinn(t) on the interval [-2π,2π] using fplot. 3. Use fplot to plot y = tanh(x) on (-2,2] with 25 points. /Draw a function using fplot instead of plot. 4. Plot c(t) = (3 cos(t), 2 sin(t), 1/10), where 0 st≤ 2m with increment 0.2 in t, in three dimension. 5: Three-dimensional surface plots are obtained by specifying a rectangular subset of the domain of a function with the meshgrid command and then using the mesh or surf commands to obtain a graph. >>x= -pi:0.1:pi; / generate array values on x-coordinate >>y=x; / Copy all values of x into y-coordinate >>[x, y]=meshgrid(x,y): / have a mesh grid (like that square of blocks in a floor or rectangle) >> z= cos(x) + cos(y) >>mesh(z) You can rotate the shape to see the surface from a different angle. 6. Draw y = (cos(x)) on the interval [-21,2m] with increment 0.1./ Do not forget to use *." when you work with arrays to do operations on each element. 7. Draw a logarithmic spiral Y = D'e *cos(2mt) for t= 0.1: 0.1:2, where D = 5 and b =.5. 8. Draw the ellipse (4cos(x), 3sin(x)) with blue color on the interval [-5.5] with increment 1. 9. Draw the parabola y = x²-6x +9 on the interval [-5,5] 10. Draw the surface of z= cos(sin(x²-y)) for x and y in [-2π, 2π].
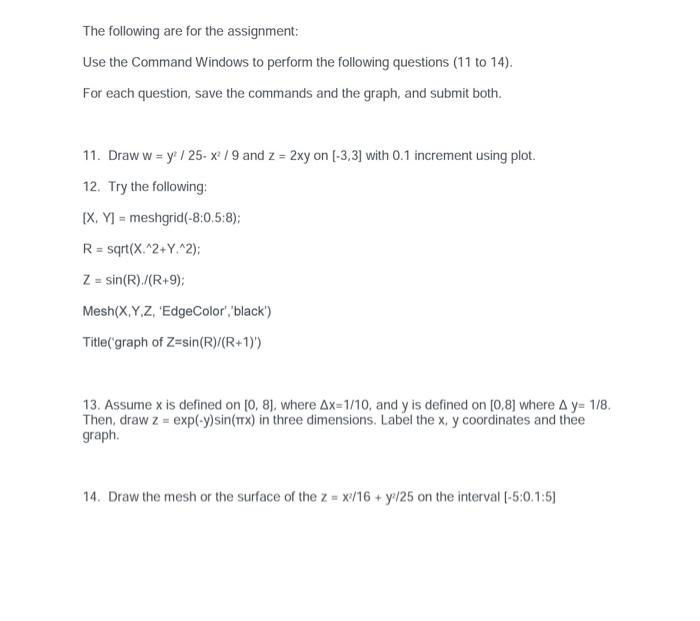
The following are for the assignment: Use the Command Windows to perform the following questions (11 to 14). For each question, save the commands and the graph, and submit both. 11. Draw w = y² / 25-x² / 9 and z = 2xy on [-3,3] with 0.1 increment using plot. 12. Try the following: [X, Y] = meshgrid(-8:0.5:8); R= sqrt(X.^2+Y.^2); Z = sin(R)./(R+9); Mesh(X,Y,Z, 'EdgeColor','black') Title('graph of Z=sin(R)/(R+1)') 13. Assume x is defined on [0, 8], where Ax=1/10, and y is defined on [0,8] where A y= 1/8. Then, draw z = exp(-y) sin(x) in three dimensions. Label the x, y coordinates and thee graph. 14. Draw the mesh or the surface of the z = x/16 + y²/25 on the interval [-5:0.1:5]