- Profitability Efficiency Liquidity Investment Financial Gearing Ii Analyse And Discuss The Differences Observed Betwe 1 (232.64 KiB) Viewed 64 times

- Profitability Efficiency Liquidity Investment Financial Gearing Ii Analyse And Discuss The Differences Observed Betwe 2 (93.48 KiB) Viewed 64 times
- Profitability Efficiency Liquidity Investment Financial Gearing Ii Analyse And Discuss The Differences Observed Betwe 3 (93.48 KiB) Viewed 64 times
. Profitability Efficiency Liquidity Investment Financial gearing ii. Analyse and discuss the differences observed between the two financial years, based on your results from (i), iii. Perform a direct analysis by looking at aspects like turnover, gross profit, net profit etc., between the selected timeframes. iv. Create graphs using the data obtained in (ii) that will clearly substantiate your analysis and discussion in (ii). V. Identify and explain difficulties when analysing the two financial years in terms of the two methods used for your analysis ii and iii above). dustrial Accounting 3 (EBIAC3A) Assignment Guidelines Page 4 of 6 vi. Analyse the companies' financial reports and describe any positive, uplifting stories about activities and accomplishments done in the past year in their financial reporting. vii. Could you clearly link a performance indicator to the COVID 19 pandemic? Explain your answer. EVALUATION OF REPORTS In evaluating your reports, the lecturer will primarily be looking at the following things: . . Evidence of your close and considered engagement with your source material and with the terms of the assignment; A clear sense of your contribution to this ongoing discussion; and A minimum of eight (8) resources should be used and correctly cited, using the Harvard method, • Referencing must be done in the body of your report as well as in the references at the end of the report. FORMATTING AND ORGANISING YOUR REPORT The following logistical things have to be considered when you are writing your report: Use the Harvard method for references (research this on the internet); Create a front page with all applicable detail; Use standard reporting format (Introduction, Body, Conclusion, References) and use figures and tables to enhance your assignment; Use numbering and headings in the body of the report to separate concepts; The minimum length is eight (8) pages; Use Arial 12 Font and 1.5 spacing; Use a minimum of 8 references; The report has to be submitted on VUTela on the given due date. DEADLINE Your report must be submitted on or before 21 May 2022 on VUTela. NO late assignments will be accepted or marked. ASSIGNMENT MARKING RUBRIC The marking rubric is shown on the next page of this document. The marking rubric is divided into 3 sections that is marked together to get to your final mark for the assignment: Section 1: Assignment Research Report (80 marks) Section 2: Powerpoint Presentation (10 marks) Section 3: Oral Presentation (10 marks)
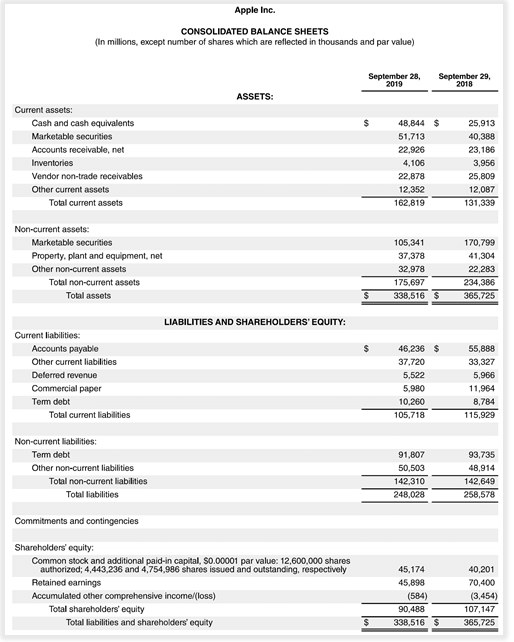
Apple Inc. CONSOLIDATED BALANCE SHEETS (In millions, except number of shares which are reflected in thousands and par value) September 28, 2019 September 29, 2018 ASSETS: Current assets: Cash and cash equivalents Marketable securities Accounts receivable, net Inventories Vendor non-trade receivables Other current assets Total current assets 48,844 $ 51,713 22,926 4,106 22,878 12,352 162,819 25.913 40,388 23,186 3,956 25,809 12,087 131,339 Non-current assets: Marketable securities Property, plant and equipment, net Other non-current assets Total non-current assets Total assets 105,341 37,378 32,978 175,697 338,516 $ 170,799 41,304 22,283 234,386 365,725 $ LIABILITIES AND SHAREHOLDERS' EQUITY: $ Current liabilities: Accounts payable Other current liabilities Deferred revenue Commercial paper Term debt Total current liabilities 46,236 $ 37.720 5,522 5,980 10,260 105,718 55,888 33,327 5.966 11,964 8.784 115,929 Non-current liabilities: Term debt Other non-current liabilities Total non-current liabilities Total liabilities 91,807 50,503 142,310 248,028 93.735 48,914 142,649 258,578 Commitments and contingencies Shareholders' equity: Common stock and additional paid-in capital, S0.00001 par value: 12,600,000 shares authorized: 4,443,236 and 4,754,986 shares issued and outstanding, respectively Retained earnings Accumulated other comprehensive income/(loss) Total shareholders' equity Total liabilities and shareholders' equity 45,174 45,898 (584) 90,488 338,516 $ 40,201 70,400 (3,454) 107,147 365,725 $