- V16 0 1 K L 2023 2020 2019 Common Size Balance Sheet 2022 2020 2019 Change Balance Sheet 2020 2023 1 2 Assets A Current 1 (97.59 KiB) Viewed 63 times
- V16 0 1 K L 2023 2020 2019 Common Size Balance Sheet 2022 2020 2019 Change Balance Sheet 2020 2023 1 2 Assets A Current 2 (80.75 KiB) Viewed 63 times
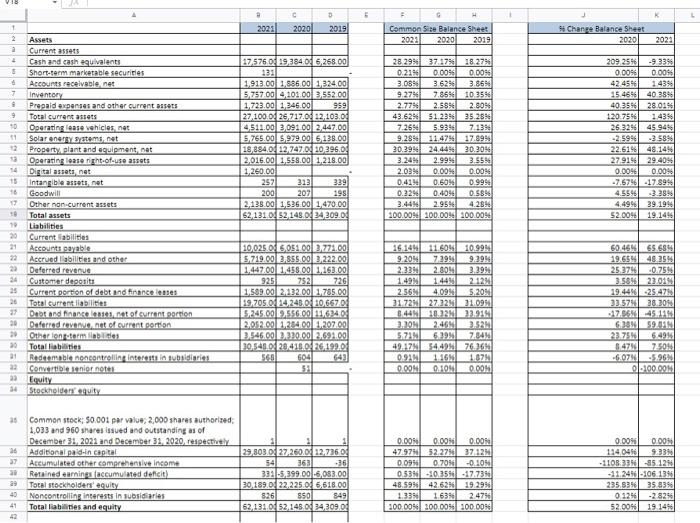
V16 0 1 K L 2023 2020 2019 Common Size Balance Sheet 2022 2020 2019 Change Balance Sheet 2020 2023 1 2 Assets a Current assets 3 Cash and cash equivalents 5 Short-term marketable securities 6 Accounts receivable.net 7 Inventory Prepaid expenses and other current 9 Total current assets 10 Operating lease vehicles net 11 Solar enersystems.net 12 Property, plant and equipment net 92 Operating lease right of use asets 14 Digital assets net Intangible 1973, net 16 Goodwill 17 Other non-current assets Total assets 19 Liabilities 20 Current abilities 21 Accounts payable 22 Accrued abilities and other 22 Deferred revenue 24 Customer deposits 25 Current portion of debt and finance leases 26 Total current 27 Debt and finance lentes.net of current portion 20 Daformed to rent portion 29 Other long terminie 30 Total abilities 21 Redeemable no controlling interests in subsidiaries 22 Convertible senioren 23 Equity 34 Stockholdenequity 17.576 0 19,384 046258.00 133 1,913.00 1,886 00 1,224.00 5,757.00 4,103.00 3,552.00 1.223.001.246.00 959 27,100.0 26,7170.22, 103.00 4,511.00 3,091.00 2,447.00 5.765.00 5.979.00 6135.00 18,894.0. 12747.0.20395.0. 2016.00 1.558.00 1,218.00 1.260.00 252 313 339 200 207 195 2,135.00 1,535,00 1.470.00 62 131 0.52 148.0.34309.0. 28 299 37.17% 18.279 0.2140 0.0096 0004 3.059 3 62% 3.85% 9.274 7.85910354 2.779 2.584 2.809 43.629 51.2398 35.289 7.255 5.9346 7134 9.25 11.479 17.899 30.39 24.449 30.2016 3.24% 2.995 3.554 2.09 0.00% 0.009 0.4190 0.60% 0.999 0.2298 0.40%. 0.58% 3.44% 2.950 4.29 100.000 100.000 100.00% 209 2546 -93395 0.0096 0004 42 4596 1439 15.4696 40.39% 40.356 28.0196 120.754 1439 25 3296 45.9496 -2.5996 -3.589 22.61% 48.149| 279195 29.4096 0.0096 0.00% -7.57% -17 899 45546 3.3999 4.499 39.1996 52.00% 19.1496 10025.06.051.00 2,271.00 5.719.00 3,855.00 3,222.00 1,447.00 1,458.00 1.163.00 925 752 726 1,599.00 2.132.00 1.785.00 19.705.0414243.0306670 5.245.00.556.00 1640 2.082.00 1.284.00 1.207.00 3546.00 2,220,00 2.699.00 30.543.0 29415.0.26.1990 565 604 533 16.144 11.604 10.995 9.2013 7299 9.3994 2.23 2.804 3.29% 1.49% 1444 2124 2.56 4.09 5.20 31.720 27.324 21.095 8.44% 10.1223.9141 10M 2.46 33.24. 5.24 6295 7.84 492654494 0.92 1.165 1.679 0.004 0.101 0.001 60.454 65.689 19.659 48.254 2537961 0.7586 35848 23.0198 19.44% -25.47% 33.574 28 304 17.864 45.11 6.289 59.000 2275 6.491 5.47% 7504 -6.07 -5.96 01:100.00M 35 36 37 Common stock: 50.001 par value 2,000 shares authorized 1,033 and 960 shares issued and outstanding as of December 31, 2021 and December 31, 2020, respectively Additional paid in capital Accumulated other comprehensive Income Retained earnings accumulated deficit) Total stockholders equity Noncontrolling interests in subsidiaries Total liabities and equity 0.00 0.00% 0.00 47.97 52.2756 37.12 0.0940 0.70% -0.1016 0.534-10.3590 -17.739 48.99% 42.62% 19.295 1.3390 1.639 2.4794 200.000 200.000 200.0096 29,803.027,260.00 12.736.00 54 363 -36 331-5,299.00 -5,083.00 20.189.0.22.225.00 6.616.00 826 850 549 62.131.0 62.148.00 24.309.03 0.00% 0.00 124048 9.33 -1108.33 -85 12 -21.24-106 134 235.834 35 839 01256 -2825 520046 19 149 29 40 41 42
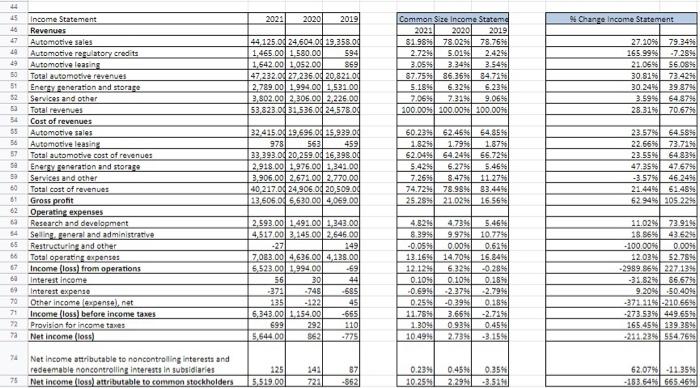
15 46 2021 2020 2019 9Change Income Statement 44, 125.0 24,604.00 19,358.00 1.465.00 1580.00 594 1,542.00 1.052.00 8691 47,232.0127.236.00 20,821.00 2.789.00 1994.00 1.531.00 3,802.00 2.305.00 2,226 00 53,823.00 31,536.00 24,578.00 Common Size Income Statemd 20231 2020 20191 31.985 78.026 78.7596 2.7296 5.0196 2.4240 3,054 3.34% 3.544 87.75% 86,36% 847196 5.1895 6.324 5.23% 2.0696 7.3195 9,0696 200.00% 200.0096 100.000 27.109 79.34% 165.9995 -7.289 21.064 SE OS 30.81% 73.42% 30.24 29.87% 3.599 64 87% 28.319 70.67% 47 44 49 50 51 52 53 34 35 50 57 52 59 80 61 Income Statement Revenues Automotive Sales Automotive rerulatory credits Automotive Leasing Total automotive revenues Energy generation and storage Services and other Total revenues Cost of revenues Automotive sales Automotive leasin Total automotive cost of revenues Enersy Feneration and storare Services and other Total cost of revenues Gross profit Operating expenses Research and development Sellingeneral and administrative Restructuring and other Total operating expenses Income (lows from operations Interest income Interest expense Other income capensel.net Income (loss) before income taxes Provision for income taxes Net Income loss) 32.415.09.695 0:25.939.00 978 563 459 33.393.00 20.259.00 16,398.00 2,918.00 1,976.00 1,349 00 3.906.002.574.00 2.770.00 40 217.00 24 906.00 20.509.00 1235050 6.630.00 4,069.00 60.239 62.464 54.859 1.82% 1.7956 1.8796 62.0496 64.2496 66.7296 5.424 6.27 5.4596 7.2656 8.4796 11.2796 747296 78.99% 83.444 25.2898 21.024 16.569 23.579 6455 22.6696 73.7196 23.559 64 834 47.359 47.57% -3.57% 46.249 21.4496 61.4896 52949 205 229 62 65 149 88 67 61 69 70 71 72 7 2.593.00 1.491.00 1.343.00 4.517.00 3.145.00 2,546.00 -27 7,083.00 4.625.00 4.138.00 5.523.00 1.994.00 -69 56 30 44 -371 -748 -685 135 -122 45 6,343.00 1.154.00 -665 699 292 110 5644.00 562 -775 4.829 8.394 -0.05% 13.16% 12.124 0.1056 -0.6946 0 2540 11.75 1.3095 10499 4,739 5.45% 9.929 10.77 0.0096 06240 14.7096] 16.8496 -02846 0.104 0.15% -2.3796 -2.790 -0.39% 0.1895 3.6540 -2.7398 0.934 0.4596 2.7346-3.159 11.029 73.9196 18.56943.629 -100.00 0.00% 12.0296 52.754 -2989.86 2271396 -31.8200 86.67% 9.2096 50.409 -371.219-210 569 -273.539 449,65% 165.459 129.3596 -211.229 554.759 Net Income attributable to noncontrolling interests and redeemable noncontrolling interests in subsidiaries Net income foss) attributable to common stockholders 125 5,519.001 141 722 87 -562 0.23% 10.250 0.45 0.35% 2.299 -3.5110 62,07% -11.354 -163.648 665.464 75