Page 1 of 1
Question 11 8 pts The graphs below show the response of a cell expressing WT receptors and one expressing mutant Nav1.7
Posted: Tue May 17, 2022 2:44 pm
by answerhappygod
- Question 11 8 Pts The Graphs Below Show The Response Of A Cell Expressing Wt Receptors And One Expressing Mutant Nav1 7 1 (46.27 KiB) Viewed 146 times
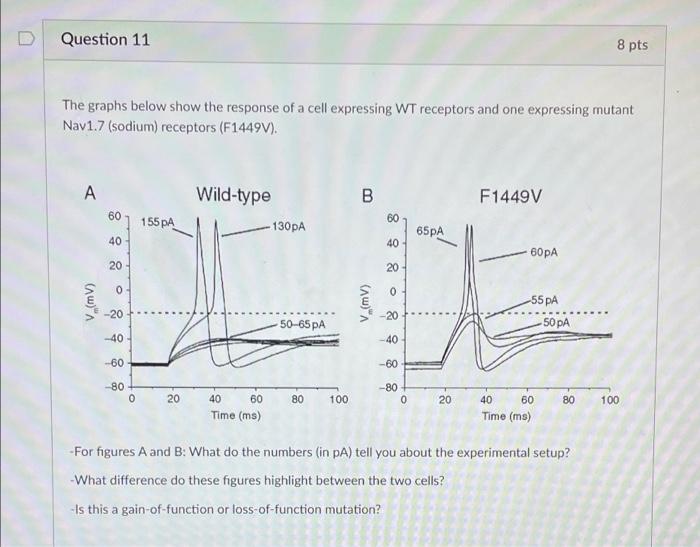
Question 11 8 pts The graphs below show the response of a cell expressing WT receptors and one expressing mutant Nav1.7 (sodium) receptors (F1449V). А Wild-type B F1449V 60] 155PA 60 130 PA 65PA 40 40 60pA 20 20 0 0 V. (mV) V (mv) ) -20 -20 -55 PA -50 PA 50-65 PA -40 -40 -60 -60 80 0 -80 0 20 80 100 20 80 100 40 60 Time (ms) 40 60 Time (ms) -For figures A and B: What do the numbers (in PA) tell you about the experimental setup? What difference do these figures highlight between the two cells? -Is this a gain-of-function or loss-of-function mutation?