2. Interpret the price indices in Exhibit 3? How do economists
construct them?
Use Excel regression to analyze the relationship between the
adjusted price index and
year. Interpret your regression findings by discussing the
coefficient of determination (R-
squared), the regression coefficient, the regression equation, and
the p-value/T Stat.
Can you use the regression equation to predict the price indices?
Take into account
statistical, macroeconomic, and other considerations.
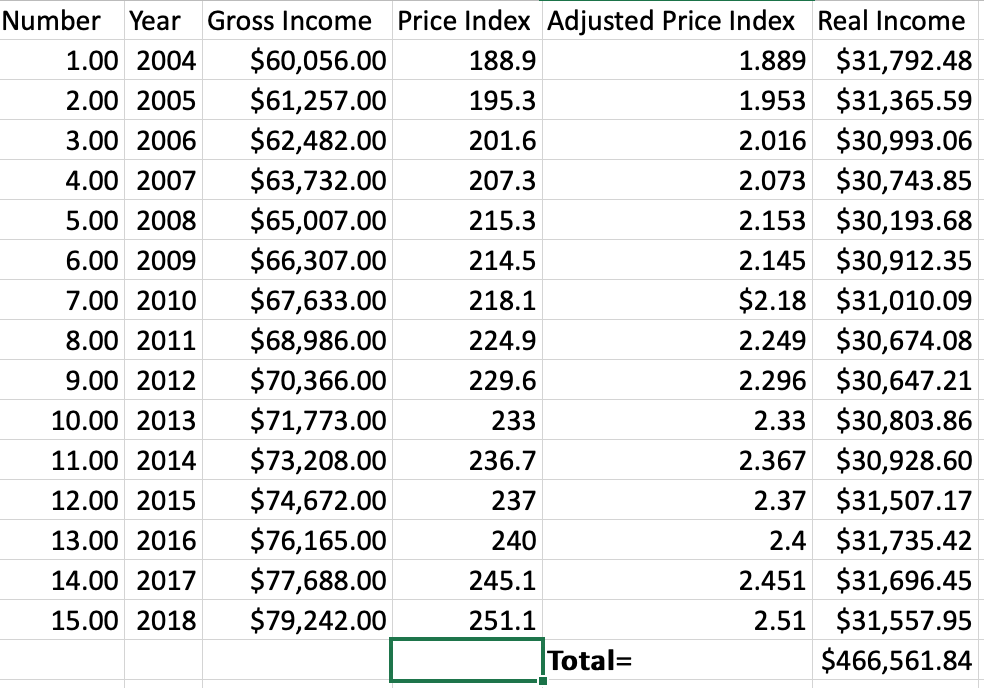
- 2 Interpret The Price Indices In Exhibit 3 How Do Economists Construct Them Use Excel Regression To Analyze The Relat 1 (110.25 KiB) Viewed 97 times
Number Year Gross Income Price Index Adjusted Price Index Real Income 1.00 2004 $60,056.00 188.9 1.889 $31,792.48 2.00 2005 $61,257.00 195.3 1.953 $31,365.59 3.00 2006 $62,482.00 201.6 2.016 $30,993.06 4.00 2007 $63,732.00 207.3 2.073 $30,743.85 5.00 2008 $65,007.00 215.3 2.153 $30,193.68 6.00 2009 $66,307.00 214.5 2.145 $30,912.35 7.00 2010 $67,633.00 218.1 $2.18 $31,010.09 8.00 2011 $68,986.00 224.9 2.249 $30,674.08 9.00 2012 $70,366.00 229.6 2.296 $30,647.21 10.00 2013 $71,773.00 233 2.33 $30,803.86 11.00 2014 $73,208.00 236.7 2.367 $30,928.60 12.00 2015 $74,672.00 237 2.37 $31,507.17 13.00 2016 $76,165.00 240 2.4 $31,735.42 14.00 2017 $77,688.00 245.1 2.451 $31,696.45 15.00 2018 $79,242.00 251.1 2.51 $31,557.95 Total= $466,561.84