- R Code Create Dataframe Where D Developmental Scores 1 Investigators Were Interested In Determine Whether Sex And A 1 (80.27 KiB) Viewed 23 times
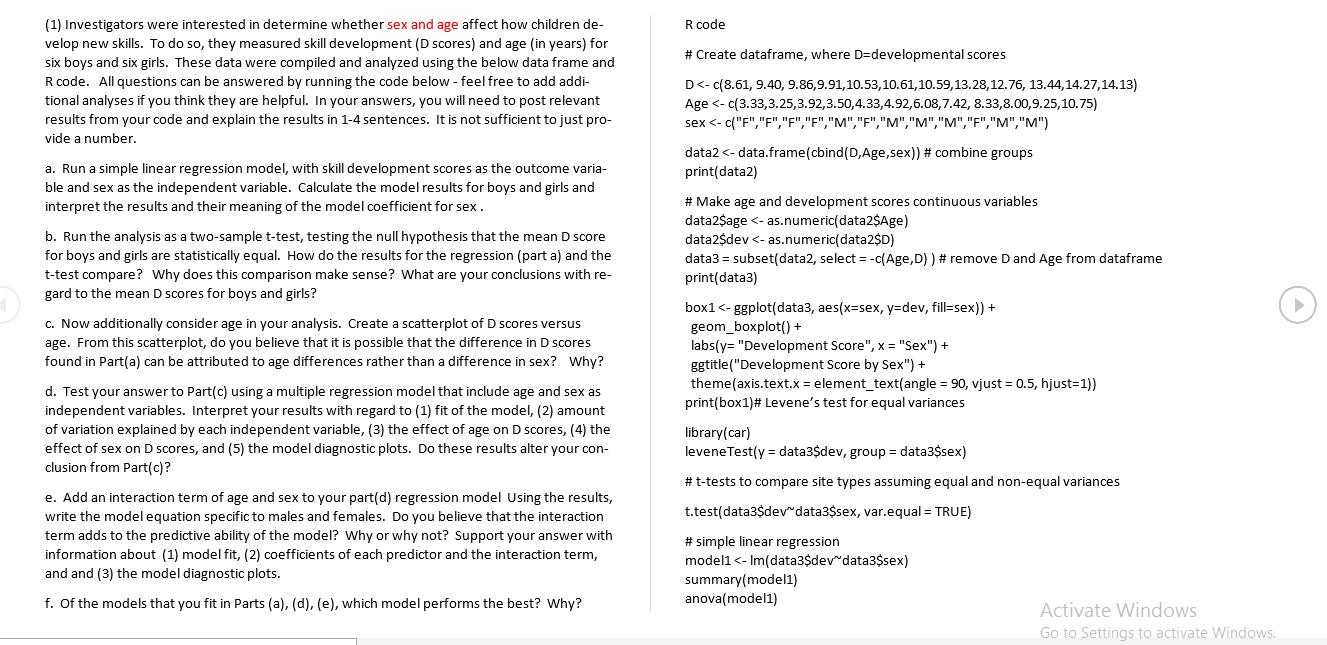
R code # Create dataframe, where D=developmental scores (1) Investigators were interested in determine whether sex and age affect how children de- velop new skills. To do so, they measured skill development (D scores) and age (in years) for six boys and six girls. These data were compiled and analyzed using the below data frame and R code. All questions can be answered by running the code below- feel free to add addi- tional analyses if you think they are helpful. In your answers, you will need to post relevant results from your code and explain the results in 1-4 sentences. It is not sufficient to just pro- vide a number D<-c(8.61, 9.40, 9.86,9.91,10.53,10.61,10.59,13.28,12.76, 13.44, 14.27,14.13) Age <-c(3.33,3.25,3.92,3.50,4.33,4.92,6.08,7.42, 8.33,8.00,9.25, 10.75) sex <-c("F","F","F","F","M","F","M","M","M","F","M","M") data2<- data.frame(cbind(D, Age,sex)) # combine groups print(data) # Make age and development scores continuous variables data2$age <-as.numeric(data2$Age) data2$dev <-as.numeric(data2$D) data3 = subset(data2, select = -c(Age,D)) #remove D and Age from dataframe print(data) a. Run a simple linear regression model, with skill development scores as the outcome varia- ble and sex as the independent variable. Calculate the model results for boys and girls and interpret the results and their meaning of the model coefficient for sex. b. Run the analysis as a two-sample t-test, testing the null hypothesis that the mean D score for boys and girls are statistically equal. How do the results for the regression (part a) and the t-test compare? Why does this comparison make sense? What are your conclusions with re- gard to the mean D scores for boys and girls? c. Now additionally consider age in your analysis. Create a scatterplot of D scores versus age. From this scatterplot, do you believe that it is possible that the difference in D scores found in Part(a) can be attributed to age differences rather than a difference in sex? Why? d. Test your answer to Part(c) using a multiple regression model that include age and sex as independent variables. Interpret your results with regard to (1) fit of the model, (2) amount of variation explained by each independent variable, (3) the effect of age on D scores, (4) the effect of sex on D scores, and (5) the model diagnostic plots. Do these results alter your con- clusion from Part(c)? e. Add an interaction term of age and sex to your part(d) regression model Using the results, write the model equation specific to males and females. Do you believe that the interaction term adds to the predictive ability of the model? Why or why not? Support your answer with information about (1) model fit, (2) coefficients of each predictor and the interaction term, and and (3) the model diagnostic plots. f. Of the models that you fit in Parts (a), (d), (e), which model performs the best? Why? box1 <- ggplot(data3, aes(x=sex, y=dev, fill=sex)) + geom_boxplot() + labs(y= "Development Score", x = "Sex") + ggtitle("Development Score by Sex") + theme (axis.text.x = element_text(angle = 90, vjust = 0.5, hjust=1)) ( = print(box1)# Levene's test for equal variances library(car) levene Test(y = data3$dev, group = data3$sex) #t-tests to compare site types assuming equal and non-equal variances t.test(data3$dev"data3$sex, var.equal = TRUE) # simple linear regression model1 <- Im(data 3$dev data3$sex) summary(modell) anova(modeli) Activate Windows Go to Settings to activate Windows.
#model diagnostics par(mfrow = c(2, 2)) #Split the plotting panel into a 2 x 2 grid plot(modell) # Plot the model information #multiple linear regression model2<- Im(data3$dev"data3$sex + data3$age) summary(model2) anova(model) plot1 <- ggplot(data3, aes(x=age, y=dev, color=sex)) + geom_point() + ggtitle("Development Score and Age") + ylab("Development Score") + xlab("Age (years)") print(plot1) #model diagnostics par(mfrow = c(2, 2)) #Split the plotting panel into a 2 x 2 grid plot(model2) # Plot the model information #multiple linear regression with interaction term model3<- Im(data3$dev"data3$sex + data3$age + data3$sex* data3$age) summary(model3) anova(model) #model diagnostics par(mfrow = c(2, 2)) # Split the plotting panel into a 2 x 2 grid plot(model3) # Plot the model information # comparison of models anova(modeli, model2) anova( model2, model3) anova(modeli, model3)