QUESTION : SUBJECT: ORANIZING VISUALIZING DATAQUANTATIVE REASONING PLEASE ATTACH CORRECT ANSWER I KEEp GETTING WRONG RESPONSE from you guys.
SUBJECT: ORANIZING VISUALIZING DATAQUANTATIVE REASONING PLEASE ATTACH CORRECT ANSWER I KEEp GETTING WRONG RESPONSE from you guys.
QUANTATIVE REASONING
PLEASE ATTACH CORRECT ANSWER I KEEp
GETTING WRONG RESPONSE from you guys.
- Question Subject Oranizing Visualizing Dataquantative Reasoning Please Attach Correct Answer I Keep Getting Wrong 1 (38.36 KiB) Viewed 35 times
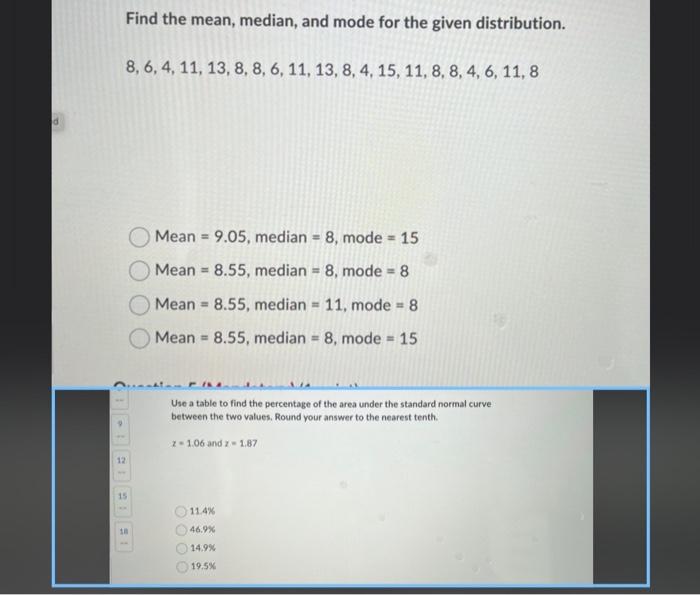
d Find the mean, median, and mode for the given distribution. 8, 6, 4, 11, 13, 8, 8, 6, 11, 13, 8, 4, 15, 11, 8, 8, 4, 6, 11, 8 Mean 9.05, median = 8, mode = 15 = Mean 8.55, median = 8, mode = 8 = Mean 8.55, median 11, mode = 8 = = Mean 8.55, median = 8, mode = 15 = Use a table to find the percentage of the area under the standard normal curve between the two values. Round your answer to the nearest tenth. Z-1.06 and 2-1.87 11.4% 46.9% 14.9% 19.5% 12 15 18