- The Following Information Applies To The Questions Displayed Below Selected Comparative Financial Statements Of Korbi 1 (78.19 KiB) Viewed 47 times
- The Following Information Applies To The Questions Displayed Below Selected Comparative Financial Statements Of Korbi 2 (23.08 KiB) Viewed 47 times
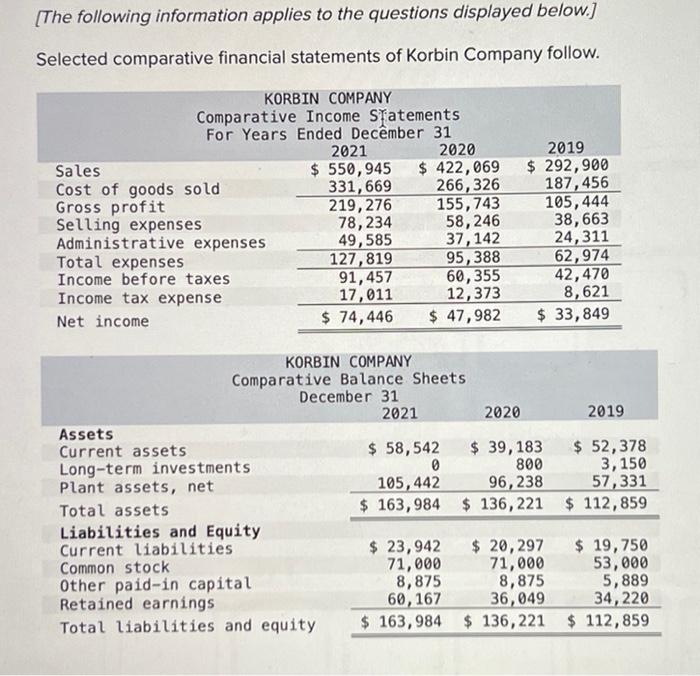
[The following information applies to the questions displayed below.] Selected comparative financial statements of Korbin Company follow. KORBIN COMPANY Comparative Income Statements For Years Ended December 31 2021 2020 2019 $ 292,900 $ 550,945 $ 422,069 331,669 266,326 187,456 Sales Cost of goods sold Gross profit Selling expenses 219,276 155,743 105,444 78,234 58,246 38,663 Administrative expenses 49,585 37,142 24,311 Total expenses 127,819 95,388 62,974 Income before taxes 91,457 60,355 42,470 Income tax expense 17,011 12,373 8,621 Net income $ 74,446 $ 47,982 $ 33,849 KORBIN COMPANY Comparative Balance Sheets December 31 2021 2020 2019 Assets Current assets $ 58,542 $ 39,183 $ 52,378 0 800 Long-term investments Plant assets, net Total assets 3,150 57,331 105,442 96,238 $ 163,984 $ 136,221 $ 112,859 Liabilities and Equity Current liabilities Common stock $ 23,942 $ 20,297 $ 19,750 71,000 53,000 Other paid-in capital 71,000 8,875 5,889 8,875 36,049 Retained earnings 60,167 34,220 Total liabilities and equity $ 163,984 $ 136,221 $ 112,859
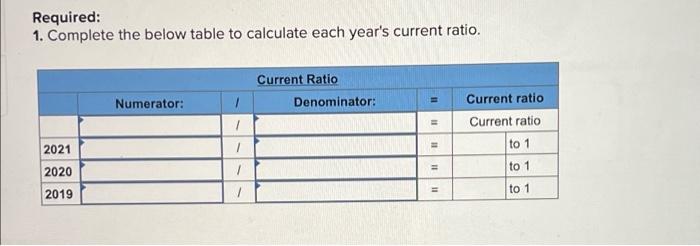
Required: 1. Complete the below table to calculate each year's current ratio. Current Ratio Numerator: 1 Denominator: = 1 = 2021 = 2020 2019 1 11 Current ratio Current ratio to 1 to 1 to 1