- 1 Please Use Excel To Do The Following Table For Row Total Columns Qty Sell Thru Sales Sale Mix 6 Co 1 (53.21 KiB) Viewed 26 times

- 1 Please Use Excel To Do The Following Table For Row Total Columns Qty Sell Thru Sales Sale Mix 6 Co 2 (53.21 KiB) Viewed 26 times
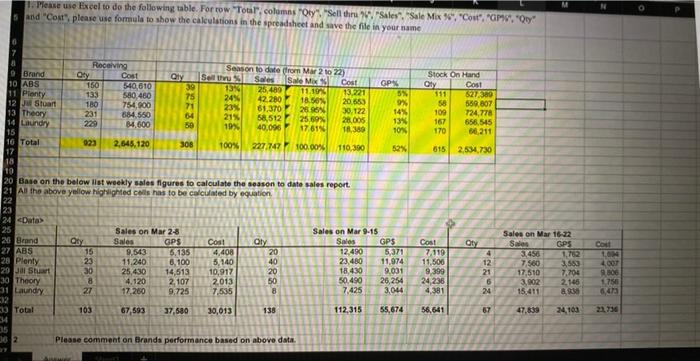
1. Please use Excel to do the following table. For row "Total", columns "Qty". "Sell thru "", "Sales", "Sale Mix 6", "Cost", "GP%", "Qty" 5 and "Cost", please use formula to show the calculations in the spreadsheet and save the file in your name 6 Receiving 9 Brand Cost Season to date from Mar 2 to 22) Sales Sale Mix % Qty Stock On Hand aty Sell thu % 13% GP% 10 ABS Cost 150 540,610 39 11 Plenty 627,380 13,221 133 111 580,460 25,409 42.280 11.19% 18.50% 75 71 24% 20.653 58 12 J Stuart 559,807 180 754,900 23% 61.370 26.95% 30,122 109 724,778 13 Theory 231 684,550 84,600 64 50 14 Laundry 21% 19% 167 656,545 229 58,512 25.69% 40,096 17.61% 28,005 18.389 170 66,211 15 16 Total 023 2,645,120 308 100% 227,747 100.00% 110,390 615 2,534,730 19 20 Base on the below list weekly sales figures to calculate the season to date sales report. 21 All the above yellow highlighted cells has to be calculated by equation 22 23 24 <Data> 25 Sales on Mar 2-8 Sales on 9-1 Sales 26 Brand Qty Sales GPS Cost Oty GPS Qty Cost 7,119 27 ABS 9,543 5,135 4,408 5,371 28 Plenty 11,240 6,100 5,140 12,490 23,480 11,974 11,506 18,430 9,031 9,390 50,490 26,254 24,236 29 Jal Stuart 25,430 14,513 10,917 30 Theory 4,120 2,107 2013 31 Laundry 17,260 9.725 7,535 7,425 3,044 4,381 32 103 33 Total 67,593 37.580 30,013 138 112,315 55,674 56,641 334 35 30 2 Please comment on Brands performance based on above data. Answer Mert 17 18 Qty PARON 15 23 30 118 27 8888 20 40 20 50 Cost 5% 9% 14% 13% 10% 52% 4 12 21 6 24 67 Sales on Mar 16-22 Sales GPS 3,456 7,500 17,510 3,902 15,411 47,839 1,762 3,553 7,704 2,146 8,938 24,103 Cost 1,004 4,007 9,806 1.756 6,473 23,736