The financial statements of Procr & Gambe (P&G) are
presented in Appendix B of your textbook. The company's complete
annual report, including the notes to the financial statements, is
available online. Refer to P&G's financial statements and the
accompanying notes to answer the following questions.
Instructions:
1. Compare and contrast the old revenue recognition guidance
with the new. Provide a thorough and clear explanation of the
changes and how those changes might impact P&G.
- The Financial Statements Of Procr Gambe P G Are Presented In Appendix B Of Your Textbook The Company S Complete Ann 1 (85.42 KiB) Viewed 28 times
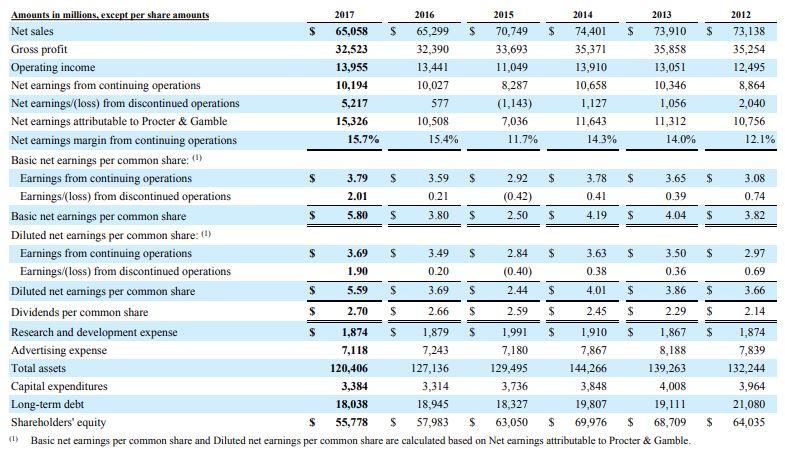
$ 2012 73,138 35,254 12,495 8,864 2,040 10,756 12.1% $ 3.08 0.74 3.82 $ Amounts in millions, except per share amounts 2017 2016 2015 2014 2013 Net sales 65,058 $ 65,299 S 70,749 $ 74,401 $ 73,910 Gross profit 32,523 32,390 33,693 35,371 35,858 Operating income 13,955 13,441 11,049 13,910 13,051 Net earnings from continuing operations 10,194 10,027 8,287 10,658 10,346 Net earnings (loss) from discontinued operations 5,217 577 (1,143) 1,127 1,056 Net earnings attributable to Procter & Gamble 15,326 10,508 7,036 11,643 11,312 Net earnings margin from continuing operations 15.7% 15.4% 11.7% 14.3% 14.0% Basie net earnings per common share: Earnings from continuing operations S 3.79 s 3.59 S 2.92 $ 3.78 $ 3.65 Earnings (loss) from discontinued operations 2.01 0.21 (0.42) 0.41 0.39 Basic net earnings per common share S 5.80 S 3.80 S 2.50 $ 4.19 $ 4.04 Diluted net earnings per common share: 1) Earnings from continuing operations S 3.69 $ 3.49 s 2.84 $ 3.63 $ 3.50 Earnings/(loss) from discontinued operations 1.90 0.20 (0.40) 0.38 0.36 Diluted net earnings per common share s 5.59 s 3.69 S 2.44 $ 4.01 $ 3.86 Dividends per common share $ 2.70 S 2.66 S 2.59 $ 2.45 $ 2.29 Research and development expense S 1,874 s 1,879 s 1,991 $ 1,910 $ 1,867 Advertising expense 7,118 7,243 7,180 7,867 8,188 Total assets 120,406 127,136 129,495 144,266 139,263 Capital expenditures 3,384 3,314 3,736 3,848 4,008 Long-term debt 18,038 18,945 18,327 19,807 19,111 Shareholders' equity S 55,778 $ 57,983 $ 63,050 $ 69,976 $ 68,709 Basic net eamings per common share and Diluted net earnings per common share are calculated based on Net earnings attributable to Procter & Gamble. $ 2.97 0.69 $ 3.66 $ 2.14 $ 1,874 7,839 132,244 3,964 21,080 64,035 $ (1)