- Objective To Study Newton S Second Law For A Given System Of Masses Using The Computer To Determine Acceleration Appar 1 (69.75 KiB) Viewed 58 times
- Objective To Study Newton S Second Law For A Given System Of Masses Using The Computer To Determine Acceleration Appar 2 (65.35 KiB) Viewed 58 times
- Objective To Study Newton S Second Law For A Given System Of Masses Using The Computer To Determine Acceleration Appar 3 (45.03 KiB) Viewed 58 times
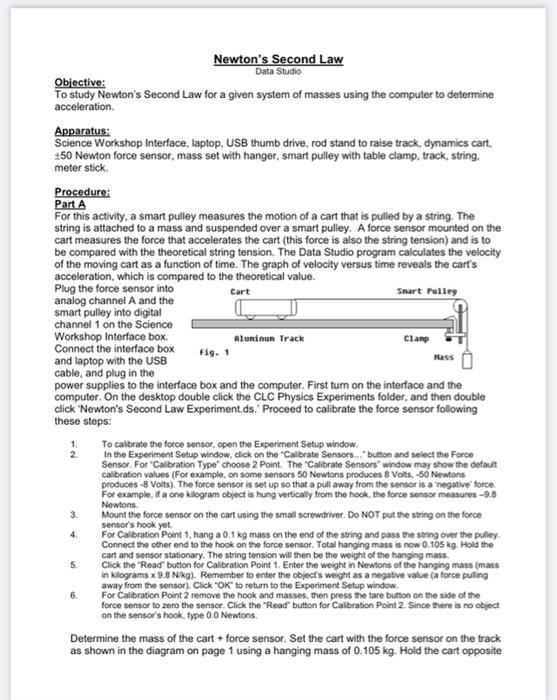
Objective: To study Newton's Second Law for a given system of masses using the computer to determine acceleration. Apparatus: Science Workshop Interface, laptop, USB thumb drive, rod stand to raise track, dynamics cart, +50 Newton force sensor, mass set with hanger, smart pulley with table clamp, track, string. meter stick. Procedure: Part A For this activity, a smart pulley measures the motion of a cart that is pulled by a string. The string is attached to a mass and suspended over a smart pulley. A force sensor mounted on the cart measures the force that accelerates the cart (this force is also the string tension) and is to be compared with the theoretical string tension. The Data Studio program calculates the velocity of the moving cart as a function of time. The graph of velocity versus time reveals the cart's acceleration, which is compared to the theoretical value. Cart Snart Pulley Plug the force sensor into analog channel A and the smart pulley into digital channel 1 on the Science Workshop Interface box. Connect the interface box and laptop with the USB cable, and plug in the power supplies to the interface box and the computer. First turn on the interface and the computer. On the desktop double click the CLC Physics Experiments folder, and then double click 'Newton's Second Law Experiment.ds. Proceed to calibrate the force sensor following these steps: 1. 2. 3. Newton's Second Law Data Studio 4. 5. 6. Fig. 1 Aluminum Track Clamp Mass To calibrate the force sensor, open the Experiment Setup window. In the Experiment Setup window, click on the "Calibrate Sensors..." button and select the Force Sensor. For "Calibration Type" choose 2 Point. The "Calibrate Sensors" window may show the default calibration values (For example, on some sensors 50 Newtons produces 8 Volts, -50 Newtons produces -8 Volts). The force sensor is set up so that a pull away from the sensor is a negative force For example, if a one kilogram object is hung vertically from the hook, the force sensor measures -9.8 Newtons. Mount the force sensor on the cart using the small screwdriver. Do NOT put the string on the force sensor's hook yet. For Calibration Point 1, hang a 0.1 kg mass on the end of the string and pass the string over the pulley. Connect the other end to the hook on the force sensor. Total hanging mass is now 0.105 kg. Hold the cart and sensor stationary. The string tension will then be the weight of the hanging mass. Click the "Read" button for Calibration Point 1. Enter the weight in Newtons of the hanging mass (mass in kilograms x 9.8 N/kg). Remember to enter the object's weight as a negative value (a force pulling away from the sensor). Click "OK" to return to the Experiment Setup window. For Calibration Point 2 remove the hook and masses, then press the tare button on the side of the force sensor to zero the sensor. Click the "Read" button for Calibration Point 2. Since there is no object on the sensor's hook, type 0.0 Newtons. Determine the mass of the cart + force sensor. Set the cart with the force sensor on the track as shown in the diagram on page 1 using a hanging mass of 0.105 kg. Hold the cart opposite
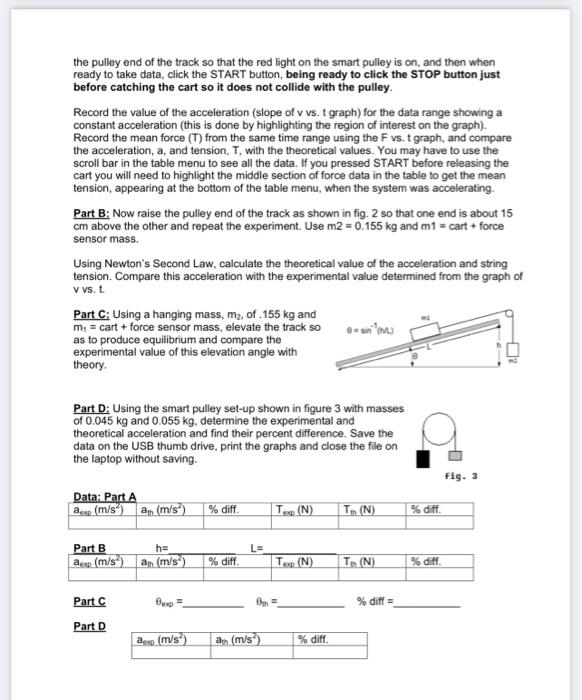
the pulley end of the track so that the red light on the smart pulley is on, and then when ready to take data, click the START button, being ready to click the STOP button just before catching the cart so it does not collide with the pulley. Record the value of the acceleration (slope of v vs. t graph) for the data range showing a constant acceleration (this is done by highlighting the region of interest on the graph). Record the mean force (T) from the same time range using the F vs. t graph, and compare the acceleration, a, and tension, T, with the theoretical values. You may have to use the scroll bar in the table menu to see all the data. If you pressed START before releasing the cart you will need to highlight the middle section of force data in the table to get the mean tension, appearing at the bottom of the table menu, when the system was accelerating. Part B: Now raise the pulley end of the track as shown in fig. 2 so that one end is about 15 cm above the other and repeat the experiment. Use m2 = 0.155 kg and m1 = cart + force sensor mass. Using Newton's Second Law, calculate the theoretical value of the acceleration and string tension. Compare this acceleration with the experimental value determined from the graph of V vs. t. Part C: Using a hanging mass, m₂, of .155 kg and m₁ = cart + force sensor mass, elevate the track so as to produce equilibrium and compare the experimental value of this elevation angle with theory. Part D: Using the smart pulley set-up shown in figure 3 with masses of 0.045 kg and 0.055 kg. determine the experimental and theoretical acceleration and find their percent difference. Save the data on the USB thumb drive, print the graphs and close the file on the laptop without saving. Data: Part A aexp (m/s) a (m/s²) Part B h= aexp (m/s) a (m/s²) Part C Part D exp= aexp (m/s) % diff. % diff. at (m/s) Tex (N) Texp (N) e-sin (NL) % diff. T(N) To (N) % diff= % diff. % diff. Fig. 3
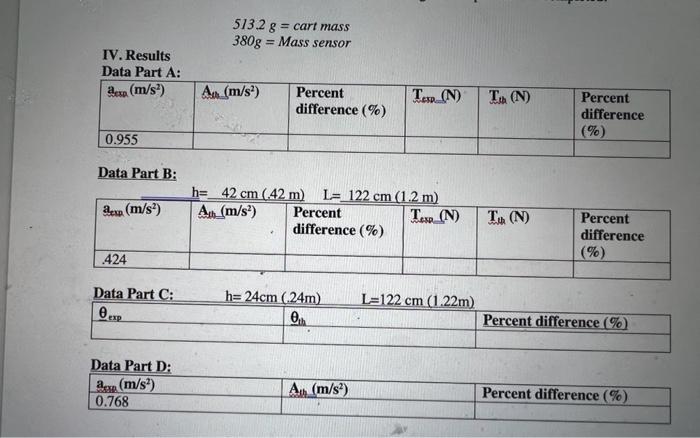
IV. Results Data Part A: Bexa(m/s²) 0.955 Data Part B: 3x (m/s²) 424 Data Part C: 0, exp Data Part D: (m/s2) 0.768 5132 g = cart mass 380g = Mass sensor Au (m/s²) Percent difference (%) h= 42 cm (42 m) L= 122 cm (1.2 m) Ath (m/s²) Tesp (N) Percent difference (%) h=24cm (24m) 0th Tex (N) Ath (m/s²) L=122 cm (1.22m) Tth (N) TU (N) Percent difference (%) Percent difference (%) Percent difference (%) Percent difference (%)