- Two Examples Data From Mendel And Devries In Genetics We Are Usually Interested In Deciding Whether Or Not The Results 1 (89.34 KiB) Viewed 16 times
- Two Examples Data From Mendel And Devries In Genetics We Are Usually Interested In Deciding Whether Or Not The Results 2 (22.77 KiB) Viewed 16 times
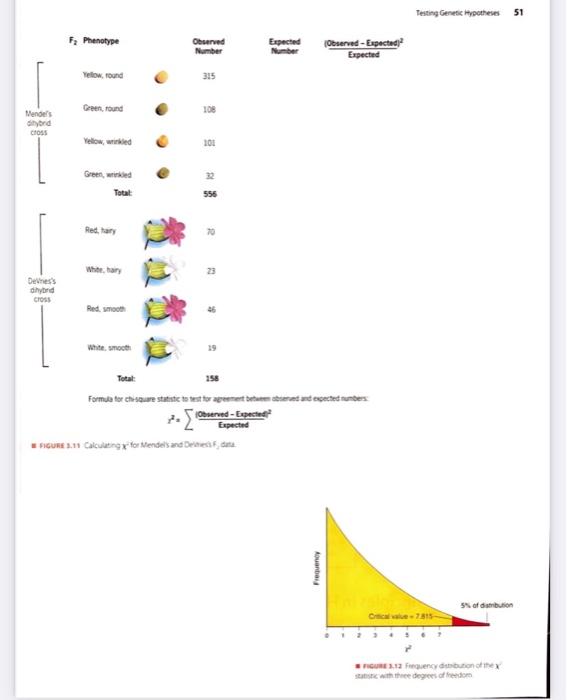
TWO EXAMPLES: DATA FROM MENDEL AND DEVRIES In genetics, we are usually interested in deciding whether or not the results of a cross are consistent with a hypothesis. As an example, let's consider the data that Mendel obtained from his dahybrid cross involving the color and texture of peas. In the F556 peas were examined and sorted into four phenotypic classes (Figure 3.3). From the data, Mendel hypothesized that pea color and texture were controlled by different genes, that each of the genes segregated two alleles-one dominant, the other recessive-and that the two genes assorted independently. Are the data from the experiment actually consistent with this hypothesis? To answer this
question, we need to compare the results of the experi ment with the predictions of the hypothesis. The comparison laid out in Figure 3.5 uggests that the experimental results are indeed consistent with the hypothesis. Across the four phenotypic classes, the discrepancies between the observed and expected numbers are small, so small in fact that we are comfortable attributing them to chance. The hypothesis that Mendel conceived to explain his data therefore fits well with the results of his dihybrid cross. If it did not, we would have reservations about accepting the hypothesis and the whole theory of Mendelism would be in doube. We consider another possibility that Mendel's data fit his hypothesis too well-in A Milestone in Genetics Mendel's 1866 Paper, which you can find in the Student Companion site. The results of a genetic experiment do not always agree with the predictions of a hypothesis as clearly as Mendel's did. Take, for example, data obtained by Hugo DeVries, one of the rediscoverers of Mendel's work. DeVries crossed different variet- ies of the campion, a plant that grew in his experimental garden. One variety had red flowers and hairy foliage, the other had white flowers and smooth foliage. The F plants all had red flowers and hairy foliage, and when intercrossed, they produced F₂ plants that sorted into four phenotypic classes (Figure 3.10). To explain the results of these crosses, De Vries proposed that flower color and foliage type were controlled by two different genes, that each gene segregated two alleles-one dominant, the other recessive and that the two genes assorted independently, that is, he simply applied Mendel's hypothesis to the campion. However, when we compare DeVries's data with the predictions of the Mendelian hypothesis, we find some disturbing discrepancies. Are these discrepancies large enough to raise
questions about the experiment or the hypothesis? THE CHI-SQUARE TEST With De Vries's data, and with other genetic data as well, we need an objective proce- dure to compare the results of the experiment with the predictions of the underlying hypothesis. This procedure has to take into account how chance might affect the outcome of the experiment. Even if the hypothesis is correct, we do not anticipate that the results of the experiment will exactly match the predictions of the hypoth- esis. If they deviate a bit, as Mendel's data did, we would ascribe the deviations to chance variation in the outcome of the experiment. However, if they deviate a lot, we would suspect that something was amiss. The experiment might have been executed poorly-for example, the crosses might have been improperly carried out, or the data might have been incorrectly recorded or, perhaps, the hypothesis is simply wrong. The possible discrepancies between observations and expectations obviously lie on a continuum from small to large, and we must decide how large they need to be for us to entertain doubts about the execution of the experiment or the acceptability of the hypothesis. One procedure for assessing these discrepancies uses a statistic called chi-square (x). A statistic is a number calculated from data-for example, the mean of a set of examination scores. The x² statistic allows a researcher to compare data, such as the numbers we get from a breeding experiment, with their predicted values. If the data are not in line with the predicted values, the x² statistic will exceed a critical number and we will decide either to reevaluate the experiment-that is, look for a mistake in technique or to reject the underlying hypothesis. If the x statistic is below this number, we tentatively conclude that the results of the experiment are consistent with Testing Genetic Hypotheses 49
Mendel's ditybrid cross Dee's dihybrid cross F: Phenotype Yellow, round Green, round Green, wrinkled Total: Red, hary Red, smooth White, smooth Observed Number 315 108 101 556 70 H 19 Expected Number FIGURE 3.11 Calculating for Mendel's and Delimess Fat Total: 158 Formula for chi-square statistic to test for agreement between observed and expected numbers (Observed-Expected Expected (Observed-Expected) Expected Aouanbaig Testing Genetic Hypotheses 51 Critical value-7815- 0123 4567 7 5% of distribution FIGURE 3.12 Frequency distribution of tex statistic with three degrees of freedom