ver a five-year period, the quarterly change in the price per share of common stock for a major oil
company ranged from -8% to 14%. A financial analyst wants to learn what can be expected for price appreciation of this stock over the next two years. Using the five-year history as a basis, the analyst is willing to assume that the change in price for each quarter is uniformly distributed between -8% and 14%. Use simulation to provide information about the price per share for the stock over the coming two-year period (eight quarters).
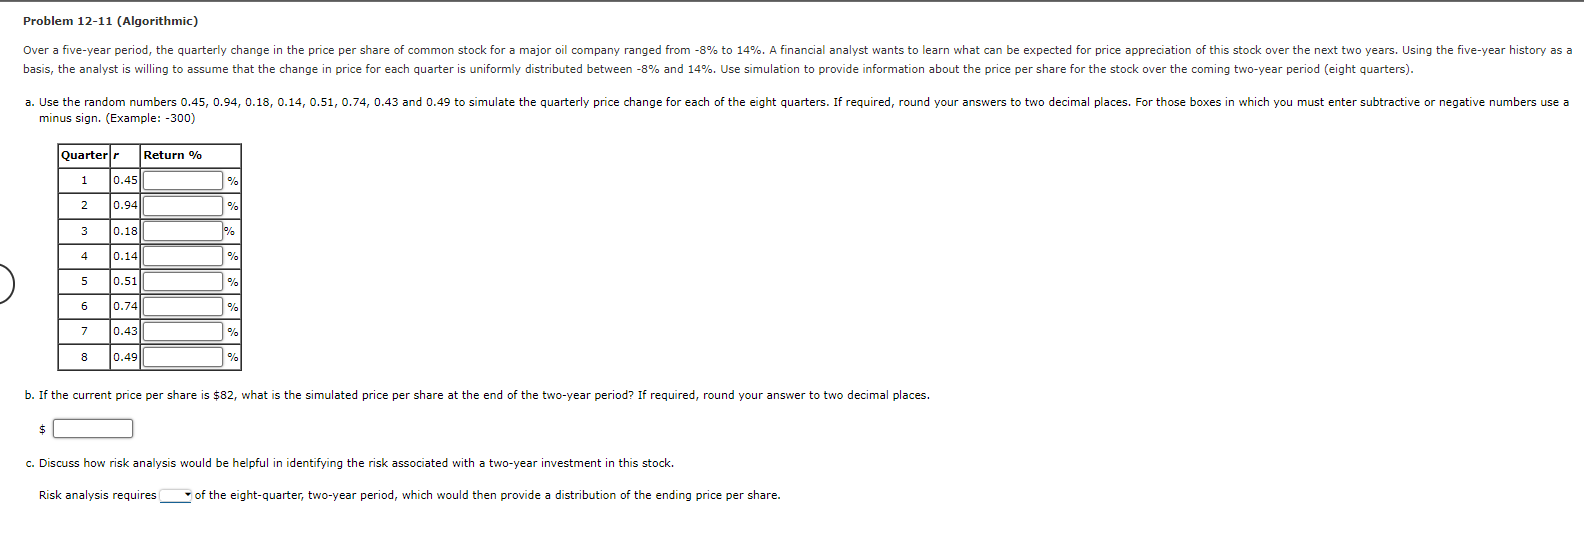
a. Use the random numbers 0.45, 0.94, 0.18, 0.14, 0.51, 0.74, 0.43 and 0.49 to simulate the quarterly price change for each of the eight quarters. If required, round your answers to two decimal places. For those boxes in which you must enter subtractive or negative numbers use a minus sign. (Example: -300)
b. If the current price per share is $82, what is the simulated price per share at the end of the two-year period? If required, round your answer to two decimal places.
c.Discuss how risk analysis would be helpful in identifying the risk associated with a two-year investment in this stock.
Discuss how risk analysis would be helpful in identifying the risk associated with a two-year investment in this stock.Risk analysis requires
one simulationmultiple simulations
of the eight-quarter, two-year period, which would then provide a distribution of the ending price per share.
- Ver A Five Year Period The Quarterly Change In The Price Per Share Of Common Stock For A Major Oil Company Ranged From 1 (40.46 KiB) Viewed 9 times
Problem 12-11 (Algorithmic) Over a five-year period, the quarterly change in the price per share of common stock for a major oil
company ranged from -8% to 14%. A financial analyst wants to learn what can be expected for price appreciation of this stock over the next two years. Using the five-year history as a basis, the analyst is willing to assume that the change in price for each quarter is uniformly distributed between -8% and 14%. Use simulation to provide information about the price per share for the stock over the coming two-year period (eight quarters). a. Use the random numbers 0.45, 0.94, 0.18, 0.14, 0.51, 0.74, 0.43 and 0.49 to simulate the quarterly price change for each of the eight quarters. If required, round your answers to two decimal places. For those boxes in which you must enter subtractive or negative numbers use a minus sign. (Example: -300) Quarter r Return % 1 0.45 0.94 0.18 0.14 0.51 $ 2 3 4 5 6 7 8 0.74 0.43 0.49 % c. Discuss how analysis Risk analysis requires % % b. If the current price per share is $82, what is the simulated price per share at the end of the two-year period? If required, round your answer to two decimal places. % be helpful in identifying the associated with a two-year investment in this stock. of the eight-quarter, two-year period, which would then provide a distribution of the ending price per share.