- Excel I Overhead Analysis And Preparing Schedules Of Cost Of Goods Using Excel S Sum And Basic Math Functions Stanford E 1 (47.71 KiB) Viewed 15 times
- Excel I Overhead Analysis And Preparing Schedules Of Cost Of Goods Using Excel S Sum And Basic Math Functions Stanford E 2 (58.66 KiB) Viewed 15 times
Excel i Overhead Analysis and Preparing Schedules of Cost of Goods using Excel's SUM and Basic Math Functions Stanford Enterprises has provided its manufacturing estimated and actual data for the year end. The Controller has asked you to compute the predetermined overhead rate, the schedule of cost of goods manufactured, and the schedule of cost of goods sold. Use the information included in the Excel Simulation and the Excel functions described below to complete the task . Cell Reference: Allows you to refer to data from another cell in the worksheet From the Excel Simulation below, if in a blank cell, "-E5 was entered, the formula would output the result from cell E5, or $275,000 in this example. Basic Math functions: Allows you to use the basic math symbols to perform mathematical functions You can use the following keys. (plus sign to add), (minus sign to subtract)." (asterisk sign to multiply), and/(forward slash to divide). From the Excel Simulation below, if in a blank cell-E6 E7" was entered, the formula would add the values from those cells and output the result, or 52.760 in this example if using the other math symbols the result would output an appropriate answer for its function. • SUM function: Allows you to refer to multiple cells and adds all the values. You can add individual cell references or ranges to utilize this function From the Excel Simulation below, if in a blank cell"SUM(E10 E11,E12) was entered, the formula would output the result of adding i those three separate cells, or 1,214,050 in this example Similarly, if in a blank cell "SUM(E10 E12) was entered, the formula would output the same result of adding those cells, except they are expressed as a range in the formula, and the result would be 1,214,050 in this example 3日ち FILE Paste B- HOME Clobort G Calbin INSERT Saved BIU- Font 11 Cost of Goods Manufactured and Cost of Goods Sold-Excel PAGE LAYOUT FORMULAS REVIEW DATA A A VIEW Alignment Number Conditional Format as Celt Formatting Table Styles Styles Cells ? 00 M Editing 5 X Sign In Help
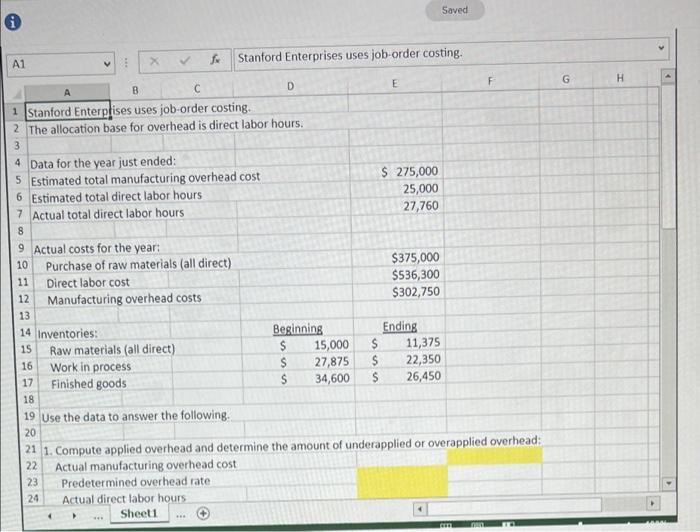
i A1 A 89 E X B C 1 Stanford Enterprises uses job-order costing. 2 The allocation base for overhead is direct labor hours. 3 7 Actual total direct labor hours 4 Data for the year just ended: 5 Estimated total manufacturing overhead cost 6 Estimated total direct labor hours 9 Actual costs for the year: 10 14 Inventories: 15 ✓ 23 24 11 12 Manufacturing overhead costs 13 Purchase of raw materials (all direct) Direct labor cost Raw materials (all direct) Work in process Finished goods fx 16 17 18 19 Use the data to answer the following. 20 *** Actual direct labor hours. Sheet1 Stanford Enterprises uses job-order costing. D Beginning $ $ $ 15,000 27,875 34,600 $ 555 E $ 275,000 25,000 27,760 $375,000 $536,300 $302,750 Ending Saved 11,375 22,350 26,450 21 1. Compute applied overhead and determine the amount of underapplied or overapplied overhead: 22 Actual manufacturing overhead cost Predetermined overhead rate F am m G H 4