- Simon Company S Year End Balance Sheets Follow At December 31 Assets Cash Accounts Receivable Net Merchandise Inventor 1 (71.41 KiB) Viewed 9 times
- Simon Company S Year End Balance Sheets Follow At December 31 Assets Cash Accounts Receivable Net Merchandise Inventor 2 (34.76 KiB) Viewed 9 times
Simon
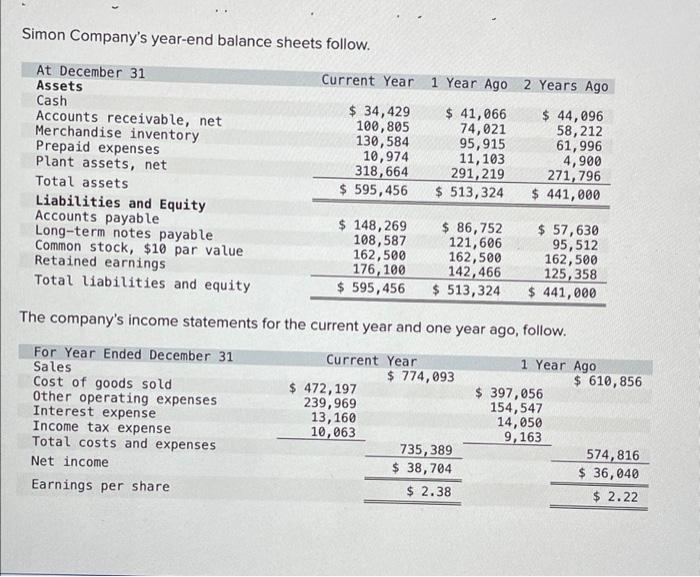
Company's year-end balance sheets follow. At December 31 Assets Cash Accounts receivable, net Merchandise inventory Prepaid expenses Plant assets, net Total assets Liabilities and Equity Accounts payable Long-term notes payable Common stock, $10 par value Retained earnings Total liabilities and equity Current Year 1 Year Ago 2 Years Ago $ 34,429 100,805 130,584 10,974 318,664 $ 595,456 $ 148,269 108,587 162,500 176, 100 $ 595,456 $ 472,197 239,969 $ 41,066 74,021 95,915 11,103 291,219 $ 513,324 13,160 10,063 $ 86,752 121,606 162,500 142,466 $ 513,324 The
company's income statements for the current year and one year ago, follow. Current Year For Year Ended December 31 Sales Cost of goods sold Other operating expenses Interest expense Income tax expense Total costs and expenses Net income Earnings per share. $ 774,093 $ 44,096 58,212 61,996 4,900 271,796 $441,000 735,389 $ 38,704 $ 2.38 $ 57,630 95,512 162,500 125,358 $ 441,000 1 Year Ago $ 397,056 154,547 14,050 9,163 $ 610,856 574,816 $ 36,040 $ 2.22
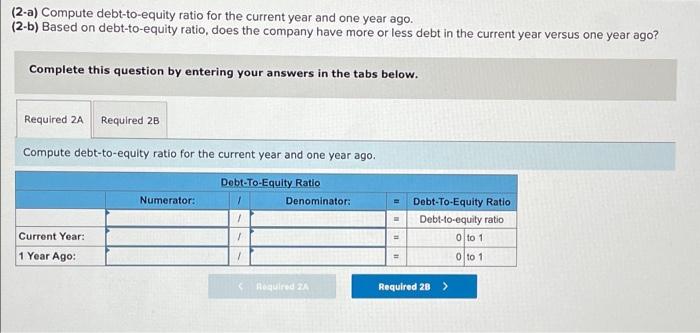
(2-a) Compute debt-to-equity ratio for the current year and one year ago. (2-b) Based on debt-to-equity ratio, does the
company have more or less debt in the current year versus one year ago? Complete this
question by entering your answers in the tabs below. Required 2A Required 2B Compute debt-to-equity ratio for the current year and one year ago. Debt-To-Equity Ratio Current Year: 1 Year Ago: Numerator: 1 1 1 Denominator: < Required ZA B Debt-To-Equity Ratio. Debt-to-equity ratio 0 to 1 0 to 1 - = = Required 28 >