- The Following Information Applies To The Questions Displayed Below Simon Company S Year End Balance Sheets Follow At 1 (59.65 KiB) Viewed 11 times
- The Following Information Applies To The Questions Displayed Below Simon Company S Year End Balance Sheets Follow At 2 (28.55 KiB) Viewed 11 times
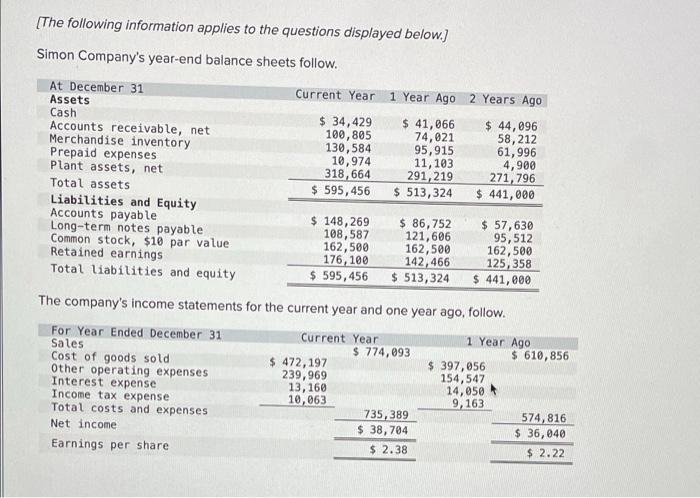
[The following information applies to the questions displayed below.] Simon
Company's year-end balance sheets follow. At December 31 Assets Cash Accounts receivable, net Merchandise inventory Prepaid expenses Plant assets, net Total assets Liabilities and Equity Accounts payable Long-term notes payable Common stock, $10 par value Retained earnings Total liabilities and equity Current Year 1 Year Ago 2 Years Ago $ 41,066 $ 44,096 $ 34,429 100,805 130,584 74,021 58,212 95,915 61,996 4,900 10,974 318,664 271,796 $441,000 $ 595,456 Interest expense Income tax expense Total costs and expenses Net income Earnings per share $ 148,269 108,587 162,500 176, 100 $ 86,752 121,606 162,500 142,466 $ 595,456 $ 513,324 11, 103 291,219 $ 513,324 The
company's income statements for the current year and one year ago, follow. Current Year 1 Year Ago For Year Ended December 31 Sales Cost of goods sold. Other operating expenses 472,197 239,969 13,160 10,063 $ 774,093 $ 57,630 95,512 162,500 125,358 $ 441,000 735,389 $ 38,704 $2.38 $ 397,056 154,547 14,050 9,163 $ 610,856 574,816 $ 36,040 $ 2.22
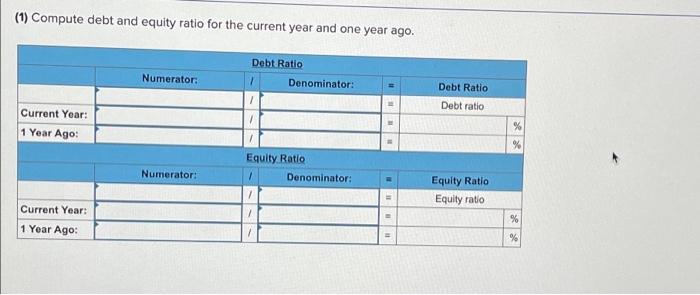
(1) Compute debt and equity ratio for the current year and one year ago. Current Year: 1 Year Ago: Current Year: 1 Year Ago: Numerator: Numerator: Debt Ratio 1 Denominator: Equity Ratio 1 Denominator: # = Debt Ratio Debt ratio Equity Ratio Equity ratio % % % %