Help with Python code! I have posted the problem, as well as the
basis of the code. I just need it filled in correctly everywhere
that is missing code (#$JES MISSING CODE$#). I have copied the
question and code below so you can easily copy and edit it. I will
give thumbs up! Thanks
- Help With Python Code I Have Posted The Problem As Well As The Basis Of The Code I Just Need It Filled In Correctly E 1 (110.5 KiB) Viewed 70 times
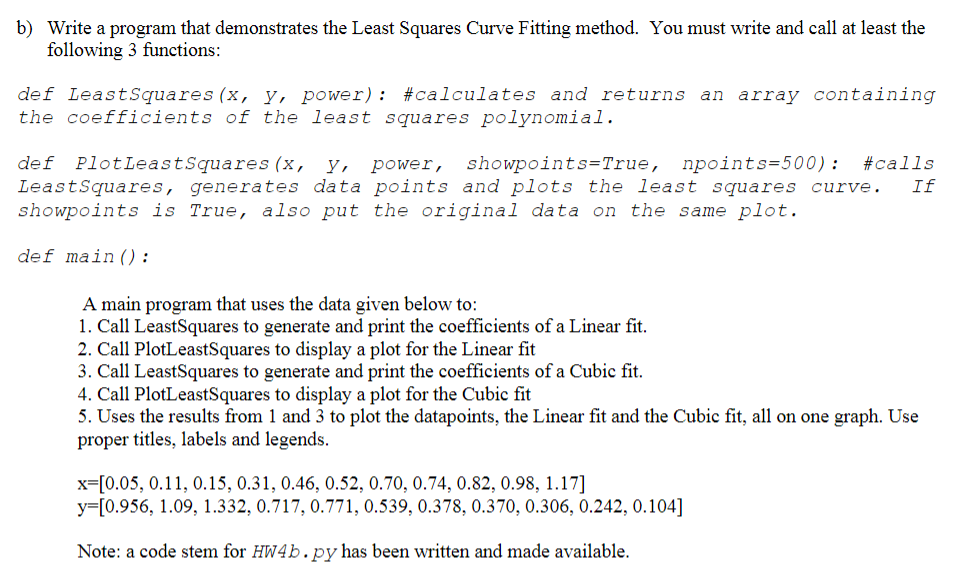
b) Write a program that demonstrates the Least Squares Curve Fitting method. You must write and call at least the following 3 functions: def Least Squares (x, y, power): #calculates and returns an array containing the coefficients of the least squares polynomial. def Plot Least Squares (x, y, power, showpoints=True, npoints=500): #calls Least Squares, generates data points and plots the least squares curve. If showpoints is True, also put the original data on the same plot. def main() : A main program that uses the data given below to: 1. Call LeastSquares to generate and print the coefficients of a Linear fit. 2. Call PlotLeastSquares to display a plot for the Linear fit 3. Call LeastSquares to generate and print the coefficients of a Cubic fit. 4. Call PlotLeastSquares to display a plot for the Cubic fit 5. Uses the results from 1 and 3 to plot the datapoints, the Linear fit and the Cubic fit, all on one graph. Use proper titles, labels and legends. x=[0.05, 0.11, 0.15, 0.31, 0.46, 0.52, 0.70, 0.74, 0.82, 0.98, 1.17] y=[0.956, 1.09, 1.332, 0.717, 0.771, 0.539, 0.378, 0.370,0.306, 0.242, 0.104] Note: a code stem for HW4b.py has been written and made available.