Prepate the ratio analysis:
a) liquidity ratio
- quick ratio
- current ratio
b) solvency ratio
- debt to equity ratio
- debt to total assets ratio
c) profitability ratio
- gross profit margin percentage
- operating profit margin percentage
- net profit margin percentage
- return on assets
- return on equity
d) activity ratio
- accounts receivable turnover ratio
- day sales in receivable
- inventory turnover ratio
- days sales in inventory
- accounts payable turnover ratio
- days purchases in payables
- Prepate The Ratio Analysis A Liquidity Ratio Quick Ratio Current Ratio B Solvency Ratio Debt To Equity Ratio 1 (37.18 KiB) Viewed 41 times
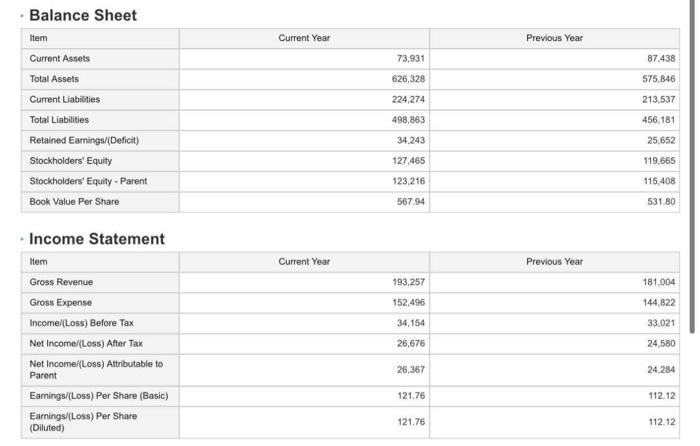
Balance Sheet Item Current Assets Total Assets Current Liabilities Total Liabilities Retained Earnings/(Deficit) Stockholders' Equity Stockholders' Equity - Parent Book Value Per Share Income Statement Item Gross Revenue Gross Expense Income/(Loss) Before Tax Net Income/(Loss) After Tax Net Income/(Loss) Attributable to Parent Earnings/(Loss) Per Share (Basic) Earnings/(Loss) Per Share (Diluted) Current Year Current Year 73,931 626,328 224,274 498,863 34,243 127,465 123,216 567.94 193,257 152,496 34,154 26,676 26,367 121.76 121.76 Previous Year Previous Year 87,438 575,846 213,537 456,181 25,652 119,665 115,408 531.80 181,004 144,822 33,021 24,580 24,284 112.12 112.12