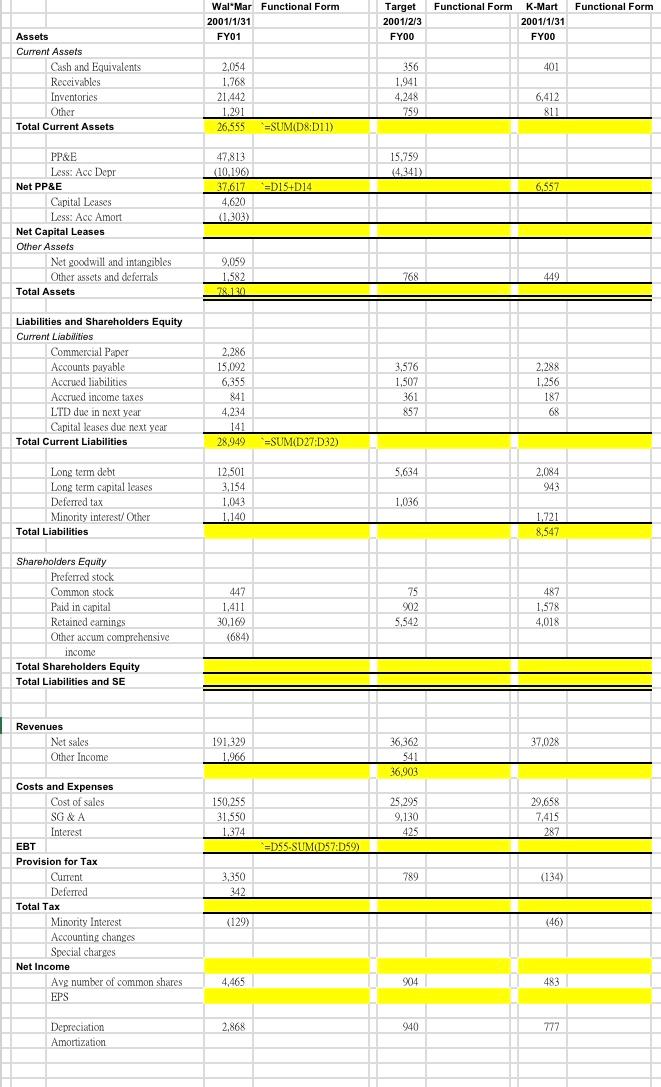
Complete the highlighted area of the following accounting
statement and financial ratios table. Some examples are given as
reference point.
- Complete The Highlighted Area Of The Following Accounting Statement And Financial Ratios Table Some Examples Are Given 1 (131.2 KiB) Viewed 90 times
Functional Form Functional Form Wal Mar Functional Form 2001/1/31 FY01 Target 2001/2/3 FYOO K-Mart 2001/1/31 FYOO 401 Assets Current Assets Cash and Equivalents Receivables Inventories Other Total Current Assets 2,054 1,768 21,442 1.291 26,555 356 1,941 4.248 759 6,412 811 =SUM(D8D11) 15,759 (4.341) 47,813 (10.196) 37.617 4,620 1.303) -=D15+D14 PP&E Less: Acc Depr Net PP&E Capital Leases Less: Acc Amort Net Capital Leases Other Assets Net goodwill and intangibles Other assets and deferrals Total Assets 6,557 9,059 1,582 28.130 768 449 Liabilities and Shareholders Equity Current Liabilities Commercial Paper Accounts payable Accrued liabilities Accrued income taxes LTD due in next year Capital leases due next year Total Current Liabilities 2.286 15,092 6,355 841 4.234 141 28,949 3,576 1,507 361 857 2,288 1,256 187 68 *=SUM D27:D32) 5,634 2.084 943 Long term debt Long term capital leases Deferred tax Minonty interest/ Other Total Liabilities 12,501 3,154 1,043 1,140 1,036 1,721 8,547 Shareholders Equity Preferred stock Common stock Paid in capital Retained earnings Other accum comprehensive income Total Shareholders Equity Total Liabilities and SE 447 1,411 30,169 (684) 75 902 5,542 487 1,578 4,018 Revenues Net sales Other Income 37,028 191,329 1,966 36,362 541 36,903 150,255 31,550 1.374 25.295 9,130 425 29,658 7,415 287 =DSS SUMD57:05) 789 (134) Costs and Expenses Cost of sales SG&A Interest EBT Provision for Tax Current Deferred Total Tax Minority Interest Accounting changes Special charges Net Income Avg number of common shares EPS 3,350 342 (129) (46) 4,465 904 483 2,868 940 777 Depreciation Amortization
Walmart Functional Form Target Functional Forn K-Mart Functional Form 0.92 =D12/D33 Current Ratio CA/CL Quick Ratio (CA-INVI/CL Cash Ratio Cash/CL Interval Measure in days) CA/ Avg daily operating exp Total Debt (TA-TE/TA Debt/Equity Total Debt / Total Equity / Equity Multiplier TA / Total Equity LT Debt Ratio LTD/LTD+TE) Times Interest earned EBIT/Interest Cash Coverage (EBIT+Depr+Amort) / Interest Days Inventory 365/(COGS/Inv) Days Receivables 365/sales/A/R) Days Payables 365 Operating exp/A/P) NWC Turnover Sales/ NWC Fixed Asset Turnover Sales / FA (every $ in FA gen $4.72 in sales) Total Asset Turnover Sales/Total Assets Profit Margin NI/Sales ROA NI/TA ROE NI/TE ROE (Dupont Identity) Profit Mang XAsst "TÔ XE M Range of Stock Prices For the Closing Quarter w w 43.69 58,44 w W 22.75 38,59 w w 5.06 8.75 P/E Ratio =N69/D70 *=N70/D70