- Ework Selected Comparative Financial Statements Of Korbin Company Follow Korbin Company Comparative Income Statements F 1 (70.21 KiB) Viewed 95 times
- Ework Selected Comparative Financial Statements Of Korbin Company Follow Korbin Company Comparative Income Statements F 2 (50.13 KiB) Viewed 95 times
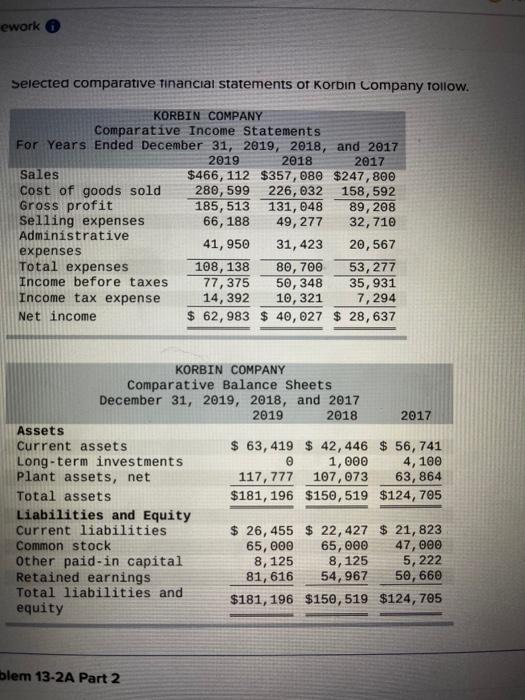
ework Selected comparative financial statements of Korbin Company follow. KORBIN COMPANY Comparative Income Statements For Years Ended December 31, 2019, 2018, and 2017 2019 2018 2017 Sales $466, 112 $357,080 $247,800 cost of goods sold 280,599 226,032 158, 592 Gross profit 185, 513 131,048 89, 208 Selling expenses 66, 188 49, 277 32, 710 Administrative 41,950 31, 423 expenses 20,567 Total expenses 108, 138 80, 700 53, 277 Income before taxes 77,375 50, 348 35,931 Income tax expense 14,392 10,321 7, 294 Net income $ 62,983 $ 40,027 $ 28, 637 KORBIN COMPANY Comparative Balance Sheets December 31, 2019, 2018, and 2017 2019 2018 2017 Assets Current assets $ 63, 419 $ 42,446 $ 56, 741 Long-term investments 1,000 4,100 Plant assets, net 117,777 107, 073 63,864 Total assets $181, 196 $150,519 $124,705 Liabilities and Equity Current liabilities $ 26,455 $ 22,427 $ 21, 823 Common stock 65,000 65,000 47,000 Other paid-in capital 8,125 8, 125 5, 222 Retained earnings 81, 616 54,967 50, 660 Total liabilities and equity $181, 196 $150, 519 $124, 705 blem 13-2A Part 2
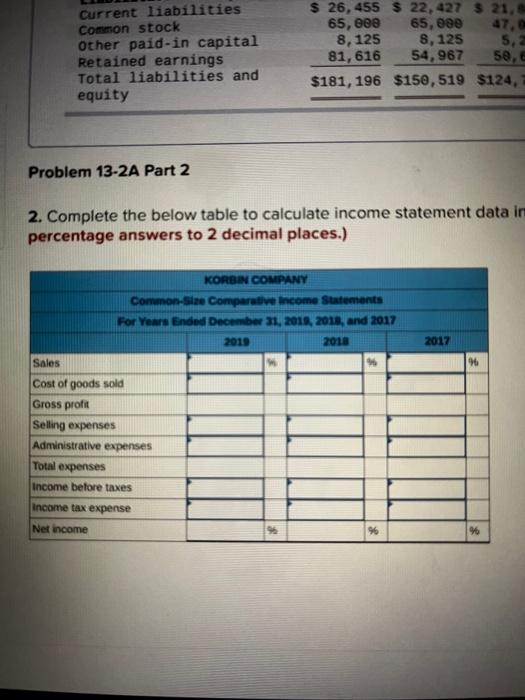
21, Current liabilities Common stock Other paid-in capital Retained earnings Total liabilities and equity $ 26,455 $ 22, 427 65,000 65,000 8, 125 8, 125 5,2 81, 616 54,967 $181, 196 $150,519 $124, 58, Problem 13-2A Part 2 2. Complete the below table to calculate income statement data in percentage answers to 2 decimal places.) 2017 46 KORBIN COMPANY Common Size Comparative Income Statements For Years Ended December 31, 2010, 2011, and 2017 2010 2018 Sales Cost of goods sold Gross profit Selling expenses Administrative expenses Total expenses Income before taxes Income tax expense Net income 96 9