I only need the reformulation from 2017 to 2021
and only couple of ratios are okay
- I Only Need The Reformulation From 2017 To 2021 And Only Couple Of Ratios Are Okay 1 (50.47 KiB) Viewed 61 times

- I Only Need The Reformulation From 2017 To 2021 And Only Couple Of Ratios Are Okay 2 (50.47 KiB) Viewed 61 times
- I Only Need The Reformulation From 2017 To 2021 And Only Couple Of Ratios Are Okay 3 (18.8 KiB) Viewed 61 times
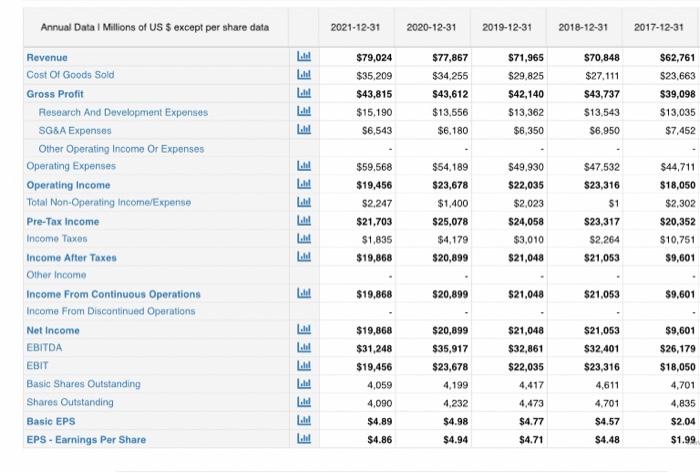
Annual Data 1 Millions of US $ except per share data 2021-12-31 2020-12-31 2019-12-31 2018-12-31 2017-12-31 EEEEE $79,024 $35,209 $43,815 $15,190 $77,867 $34.255 $43,612 $71,965 $29.825 $42,140 $13,362 $6,350 $70,848 $27.111 $43.737 $13,543 $62,761 $23,663 $39,098 $13,035 $7,452 $13,556 $6.180 $6,543 $6.950 $54,189 $44,711 Revenue Cost Of Goods Sold Gross Profit Research And Development Expenses SG&A Expenses Other Operating Income Or Expenses Operating Expenses Operating Income Total Non-Operating Income/Expense Pre-Tax Income Income Taxes Income After Taxes Other Income Income From Continuous Operations Income From Discontinued Operations Net Income EBITDA $47,532 $23,316 $1 $18,050 $2,302 EEEEEE $59,568 $19,456 $2,247 $21.703 $1,835 $19,868 $23,678 $1,400 $25,078 $4,179 $20,899 $49,930 $22,035 $2,023 S24.058 $3,010 $21,048 $23,317 $2,264 $21,053 $20,352 $10,751 $9,601 E $19,868 $20,899 $21,048 $21,053 $9,601 $21,053 $32,401 EBIT EEEEEEE $19,868 $31,248 $19,456 4,059 4,090 $4.89 $4.86 $20,899 $35,917 $23,678 4,199 $21,048 $32,861 $22,035 4,417 Basic Shares Outstanding Shares Outstanding Basic EPS EPS - Earnings Per Share $9,601 $26,179 $18,050 4,701 4,835 4,232 $23,316 4,611 4.701 $4.57 $4.48 4,473 $4.77 $4.71 $4.98 $2.04 $1.99 $4.94
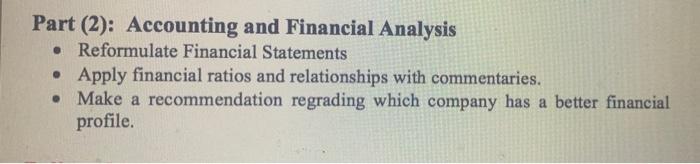
Part (2): Accounting and Financial Analysis • Reformulate Financial Statements • Apply financial ratios and relationships with commentaries. • Make a recommendation regrading which company has a better financial profile.