Business, Finance, Economics, Accounting, Operations Management, Computer Science, Electrical Engineering, Mechanical Engineering, Civil Engineering, Chemical Engineering, Algebra, Precalculus, Statistics and Probabilty, Advanced Math, Physics, Chemistry, Biology, Nursing, Psychology, Certifications, Tests, Prep, and more.
-
answerhappygod
- Site Admin
- Posts: 899604
- Joined: Mon Aug 02, 2021 8:13 am
Post
by answerhappygod »
Fill out the table with the values and show the work, Please.
Thank you.
- Fill Out The Table With The Values And Show The Work Please Thank You 1 (599.76 KiB) Viewed 39 times
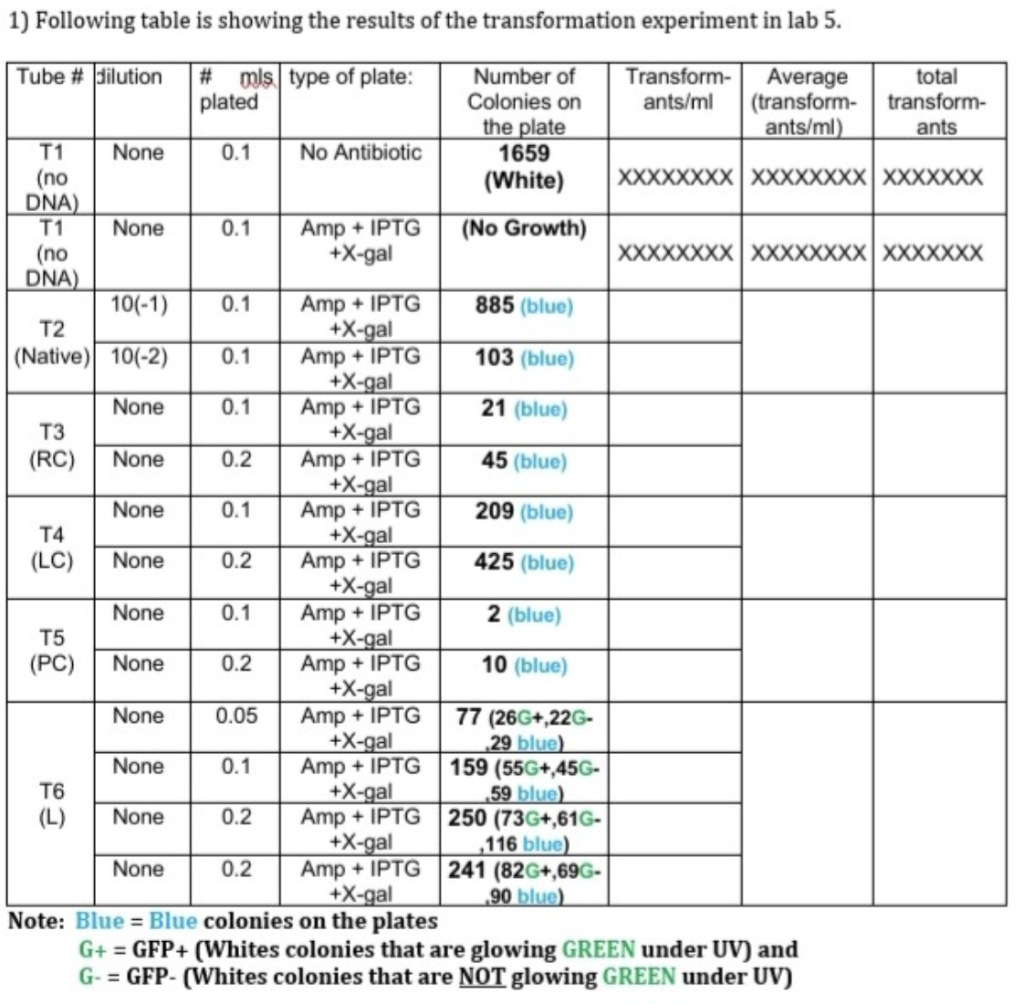
1) Following table is showing the results of the transformation experiment in lab 5. 10(-1) T2 Tube # dilution # mls type of plate: Number of Transform- Average total plated Colonies on ants/ml (transform- transform- the plate ants/ml) ants T1 None 0.1 No Antibiotic 1659 (no (White) XXXXXXXX XXXXXXXXXXXXXXX DNA) T1 None 0.1 Amp + IPTG (No Growth) (no +X-gal XXXXXXXXXXXXXXXXXXXXXXX DNA) 0.1 Amp + IPTG 885 (blue) +X-gal (Native) 10(-2) 0.1 Amp + IPTG 103 (blue) +X-gal None 0.1 Amp + IPTG 21 (blue) T3 +X-gal (RC) None 0.2 Amp + IPTG 45 (blue) +X-gal None 0.1 Amp + IPTG 209 (blue) T4 +X-gal (LC) None 0.2 Amp + IPTG 425 (blue) +X-gal None 0.1 Amp + IPTG 2 (blue) +X-gal (PC) None 0.2 Amp + IPTG 10 (blue) +X-gal None 0.05 Amp + IPTG 77 (26G+,22G- +X-gal 29 blue) None 0.1 Amp + IPTG 159 (55G+,45G- T6 +X-gal .59 blue) (L) None 0.2 Amp + IPTG 250 (73G+,61G- +X-gal ,116 blue) None 0.2 Amp + IPTG 241 (82G+,69G- +X-gal 90 blue) Note: Blue = Blue colonies on the plates G+ = GFP+ (Whites colonies that are glowing GREEN under UV) and G- = GFP- (Whites colonies that are NOT glowing GREEN under UV) T5
Join a community of subject matter experts. Register for FREE to view solutions, replies, and use search function. Request answer by replying!