- Selected Comparative Financial Statements Of Haroun Company Follow Thousands Sales Cost Of Goods Sold Gross Profit 1 (472.32 KiB) Viewed 46 times
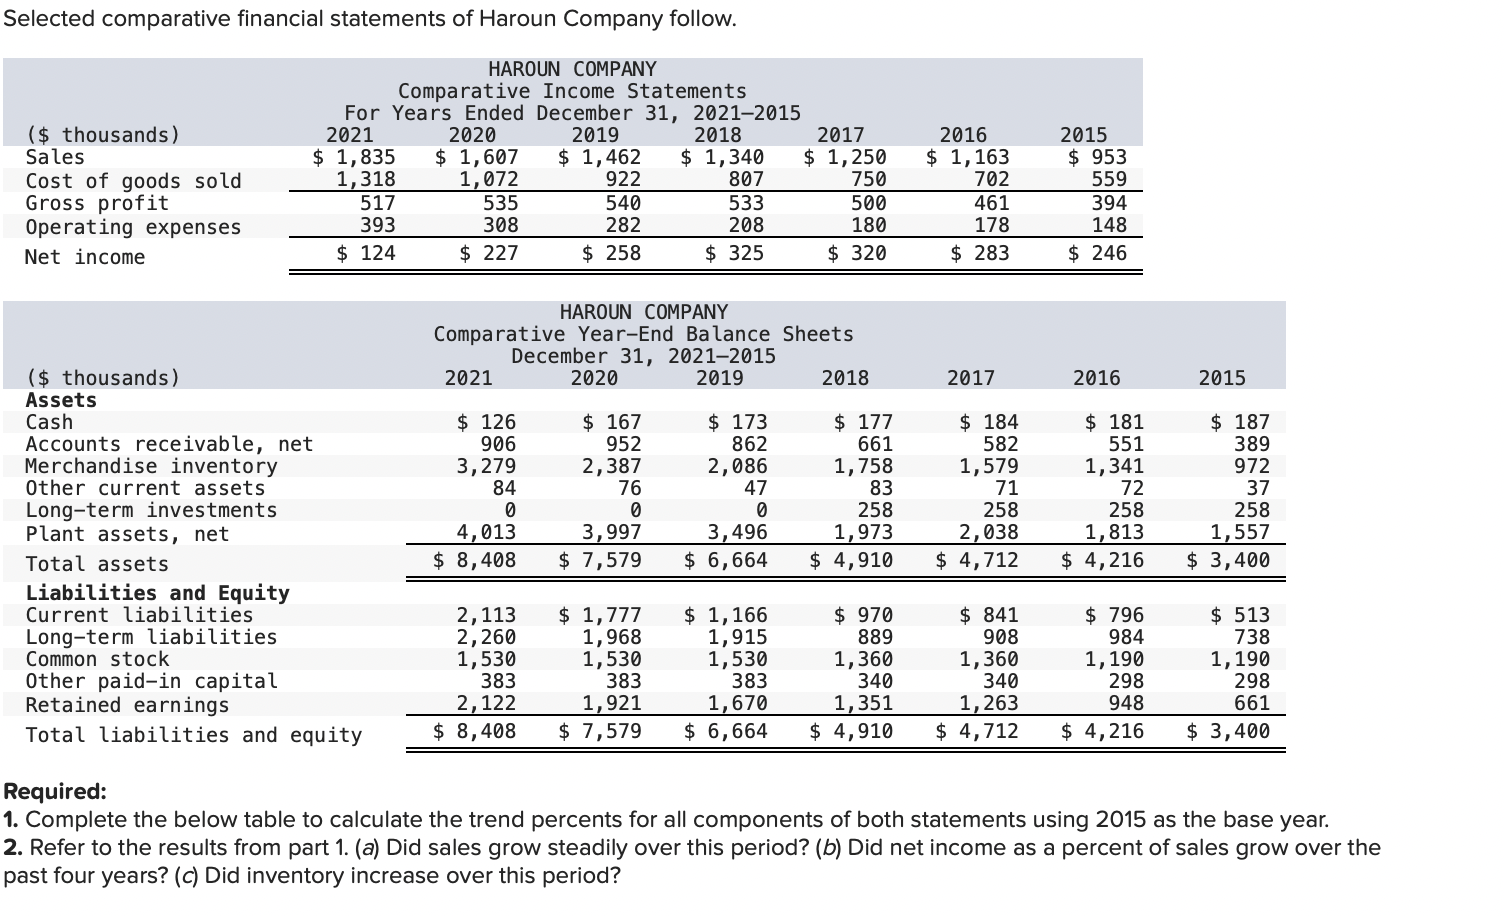
Selected comparative financial statements of Haroun Company follow. ($ thousands) Sales Cost of goods sold Gross profit Operating expenses Net income HAROUN COMPANY Comparative Income Statements For Years Ended December 31, 2021-2015 2021 2020 2019 2018 2017 $ 1,835 $ 1,607 $ 1,462 $ 1,340 $ 1,250 1,318 1,072 922 807 750 517 535 540 533 500 393 308 282 208 180 $ 124 $ 227 $ 258 $ 325 $ 320 2016 $ 1,163 702 461 178 $ 283 2015 $ 953 559 394 148 $ 246 HAROUN COMPANY Comparative Year-End Balance Sheets December 31, 2021-2015 2021 2020 2019 2018 2017 2016 2015 ($ thousands) Assets Cash Accounts receivable, net Merchandise inventory Other current assets Long-term investments Plant assets, net Total assets Liabilities and Equity Current liabilities Long-term liabilities Common stock Other paid-in capital Retained earnings Total liabilities and equity $ 126 906 3,279 84 0 4,013 $ 8,408 $ 167 952 2,387 76 0 3,997 $ 7,579 $ 173 862 2,086 47 0 3,496 $ 6,664 $ 177 661 1,758 83 258 1,973 $ 4,910 $ 184 582 1,579 71 258 2,038 $ 4,712 $ 181 551 1,341 72 258 1,813 $ 4,216 $ 187 389 972 37 258 1,557 $ 3,400 2,113 2,260 1,530 383 2,122 $ 8,408 $ 1,777 1,968 1,530 383 1,921 $ 7,579 $ 1,166 1,915 1,530 383 1,670 $ 6,664 $ 970 889 1,360 340 1,351 $ 4,910 $ 841 908 1,360 340 1,263 $ 4,712 $ 796 984 1,190 298 948 $ 4,216 $ 513 738 1,190 298 661 $ 3,400 Required: 1. Complete the below table to calculate the trend percents for all components of both statements using 2015 as the base year. 2. Refer to the results from part 1. (a) Did sales grow steadily over this period? (b) Did net income as a percent of sales grow over the past four years? (C) Did inventory increase over this period?
HAROUN COMPANY Balance Sheet Trends December 31, 2021-2015 2021 2020 2019 2018 2017 2016 2015 Assets Cash % % % % % % 100.0 % Accounts receivable, net 100.0 Merchandise inventory 100.0 Other current assets 100.0 Long-term investments 100.0 Plant assets, net 100.0 Total assets % % % % % % 100.0 % Liabilities and Equity Current liabilities % % % % % % 100.0 % Long-term liabilities 100.0 Common stock 100.0 100.0 Other paid-in capital Retained earnings 100.0 Total liabilities & equity % % % % % % 100.0 %
HAROUN COMPANY Income Statement Trends For Years Ended December 31, 2021-2015 2021 2020 2019 2018 2017 2016 2015 Sales % % % % % % 100.0% 100.0 Cost of goods sold Gross profit 100.0 Operating expenses 100.0 Net income % % % % % % 100.0 %
(a) Did sales grow steadily over this period? Assessment Tool iFrame nt of sales grow over the past four years? (c) Did inventory increase over this period?