Business, Finance, Economics, Accounting, Operations Management, Computer Science, Electrical Engineering, Mechanical Engineering, Civil Engineering, Chemical Engineering, Algebra, Precalculus, Statistics and Probabilty, Advanced Math, Physics, Chemistry, Biology, Nursing, Psychology, Certifications, Tests, Prep, and more.
-
answerhappygod
- Site Admin
- Posts: 899604
- Joined: Mon Aug 02, 2021 8:13 am
Post
by answerhappygod »
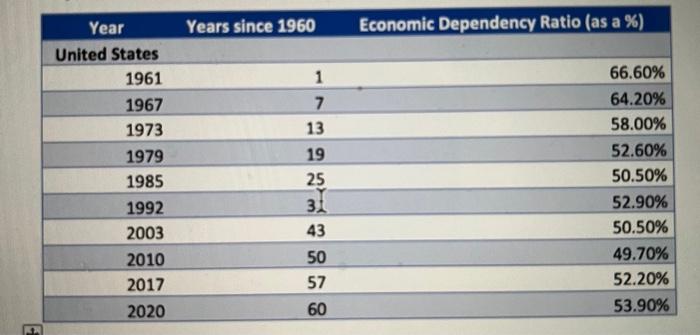
- Year United States 1961 1967 1973 1979 1985 1992 2003 2010 2017 2020 Years Since 1960 1 7 13 19 25 31 43 50 57 60 Econom 1 (30.64 KiB) Viewed 25 times
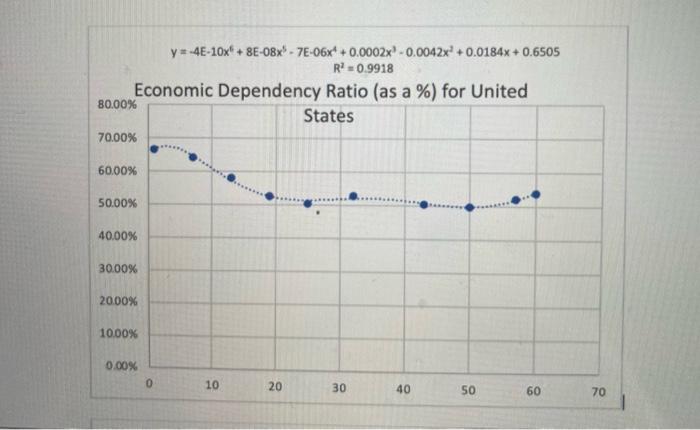
- Year United States 1961 1967 1973 1979 1985 1992 2003 2010 2017 2020 Years Since 1960 1 7 13 19 25 31 43 50 57 60 Econom 2 (32.06 KiB) Viewed 25 times
Year United States 1961 1967 1973 1979 1985 1992 2003 2010 2017 2020 Years since 1960 1 7 13 19 25 31 43 50 57 60 Economic Dependency Ratio (as a %) 66.60% 64.20% 58.00% 52.60% 50.50% 52.90% 50.50% 49.70% 52.20% 53.90%
y=-4E-10x¹ +8E-08x¹-7E-06x¹ + 0.0002x¹-0.0042x² +0.0184x+0.6505 R² = 0.9918 Economic Dependency Ratio (as a %) for United States 80.00% 70.00% 60.00% 50.00% 40.00% 30.00% 20.00% 10.00% 0.00% 20 30 50 60 0 10 40 70
Join a community of subject matter experts. Register for FREE to view solutions, replies, and use search function. Request answer by replying!