Page 1 of 1
7. A fleet of 40 ships were observed over a ten year period. Recorded variables were the wmber of incidents resulting in
Posted: Fri Apr 29, 2022 11:27 am
by answerhappygod
- 7 A Fleet Of 40 Ships Were Observed Over A Ten Year Period Recorded Variables Were The Wmber Of Incidents Resulting In 1 (34.7 KiB) Viewed 24 times
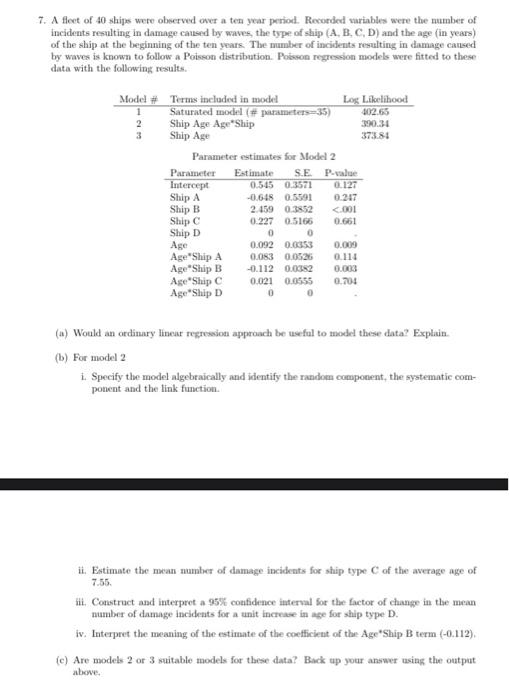
7. A fleet of 40 ships were observed over a ten year period. Recorded variables were the wmber of incidents resulting in damage caused by waves the type of ship (A, B, C, D) and the age (in years) of the ship at the beginning of the ten years. The member of incidents resulting in damage caused by waves is known to follow a Poisson distribution. Poisson regression models were fitted to these data with the following results. 0.121 Model # Terms included in model Log Likelihood 1 Saturated model (# parameters35) 402.65 2 Ship Age Age Ship 390.34 3 Ship Age 37581 Parameter estimates for Model 2 Parameter Estimate SE P-value Intercept 0.545 0.3571 Ship A -0.648 0.5591 0.217 Ship B 2.459 0.3852 <.001 Ship C 0.227 0.5166 0.661 Ship D 0 0 Age 0.092 0.0353 0.009 Age"Ship A 0.083 0.0526 0.114 Age"Ship B -0.112 0.0382 0.003 Age Ship 0.021 0.0555 0.701 Age "Ship D 0 0 (a) Would an ordinary linear regression approach be useful to model these data? Explain. (b) For model 2 1. Specify the model algebraically and identify the random component, the systematic com- ponent and the link function. ii. Estimate the mean number of damage incidents for ship type of the average age of 7.55 ii. Construct and interpret a 95% confidence interval for the factor of change in the mean number of damage incidents for a unit increase in age for ship type D. iv. Interpret the meaning of the estimate of the coefficient of the Age 'Ship B term (-0.112). (e) Are models 2 or 3 suitable models for these data? Back up your answer using the output above.