Page 1 of 1
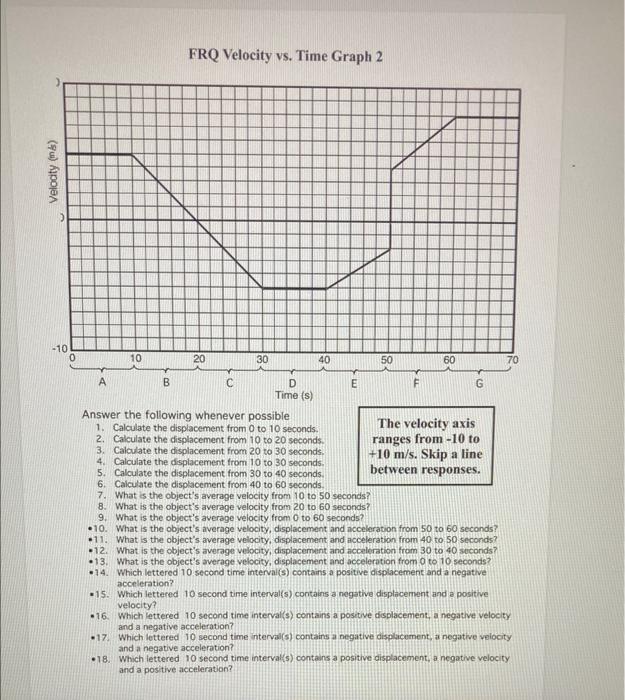
FRQ Velocity vs. Time Graph 2 Veloaty fin ) -10 0 10 20 30 40 50 60 70 G А B C D E F G Time (s) Answer the following whe
Posted: Fri Apr 29, 2022 10:47 am
by answerhappygod
- 1 (89.16 KiB) Viewed 21 times
FRQ Velocity vs. Time Graph 2 Veloaty fin ) -10 0 10 20 30 40 50 60 70 G А B C D E F G Time (s) Answer the following whenever possible 1. Calculate the displacement from 0 to 10 seconds. The velocity axis 2. Calculate the displacement from 10 to 20 seconds. ranges from - 10 to 3. Calculate the displacement from 20 to 30 seconds +10 m/s. Skip a line 4. Calculate the displacement from 10 to 30 seconds 5. Calculate the displacement from 30 to 40 seconds between responses. 6. Calculate the displacement from 40 to 60 seconds. 7. What is the object's average velocity from 10 to 50 seconds? 8. What is the object's average velocity from 20 to 60 seconds? 9. What is the object's average velocity from 0 to 60 seconds? •10. What is the object's average velocity, displacement and acceleration from 50 to 60 seconds? .11. What is the object's average velocity, displacement and acceleration from 40 to 50 seconds? .12. What is the object's average velocity, displacement and acceleration from 30 to 40 seconds? • 13. What is the object's average velocity, displacement and acceleration from 0 to 10 seconds? 14. Which lettered 10 second time interval(s) contains a positive displacement and a negative acceleration? - 15. Which lettered 10 second time interval(s) contains a negative displacement and a positive velocity? •16. Which lettered 10 second time interval(s) contains a positive displacement, a negative velocity and a negative acceleration? -17. Which lettered 10 second time interval(s) contains a negative displacement, a negative velocity and a negative acceleration? 18. Which lettered 10 second time interval(s) contains a positive displacement, a negative velocity and a positive acceleration?