Page 1 of 1
12.8. (a) The Weibull plots shown in Fig. 12.17 were generated at two different strain rates ėj = 2 x 10⁻⁶-' and € = 2 x
Posted: Fri Apr 29, 2022 10:06 am
by answerhappygod
- 12 8 A The Weibull Plots Shown In Fig 12 17 Were Generated At Two Different Strain Rates Ej 2 X 10 6 And 2 X 1 (61.8 KiB) Viewed 32 times
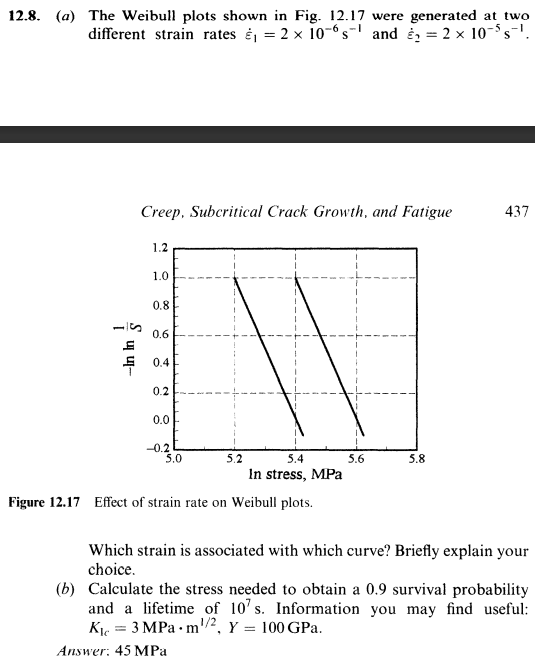
12.8. (a) The Weibull plots shown in Fig. 12.17 were generated at two different strain rates ėj = 2 x 10⁻⁶-' and € = 2 x 10-55'. Creep. Subcritical Crack Growth, and Fatigue 437 1.2 1.0 0.8 0 0.6 E $ 0.4 0.2 0.0 -0.2 5.0 5.2 5.6 5.8 5.4 In stress, MPa Figure 12.17 Effect of strain rate on Weibull plots. Which strain is associated with which curve? Briefly explain your choice. (b) Calculate the stress needed to obtain a 0.9 survival probability and a lifetime of 10's. Information you may find useful: Ke = 3 MPa · m2, Y = 100 GPa. Answer: 45 MPa