Page 1 of 1
Problem #2 in cm for the conditions presented is (5 p): The stream flow data shown below were recorded at a river gage d
Posted: Thu Apr 28, 2022 8:37 pm
by answerhappygod
- Problem 2 In Cm For The Conditions Presented Is 5 P The Stream Flow Data Shown Below Were Recorded At A River Gage D 1 (57.63 KiB) Viewed 20 times
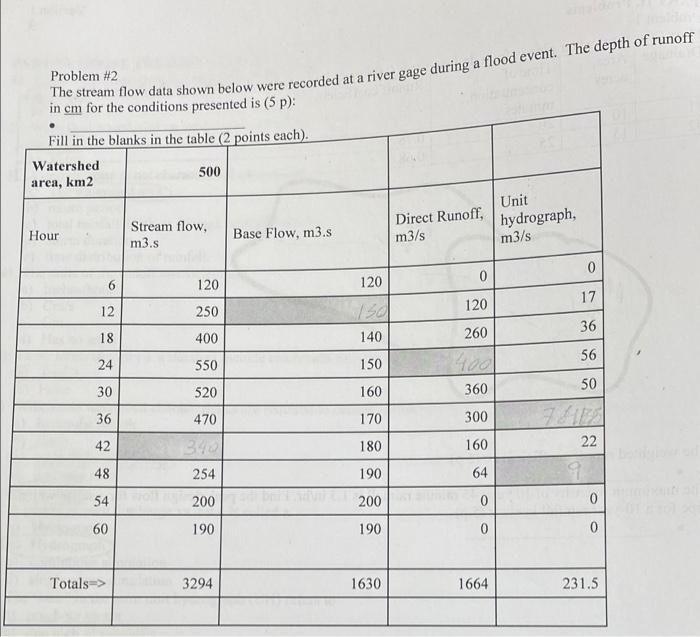
Problem #2 in cm for the conditions presented is (5 p): The stream flow data shown below were recorded at a river gage during a flood event. The depth of runoff Fill in the blanks in the table (2 points each). Watershed area, km2 500 Stream flow, m3.s Unit hydrograph, m3/s Direct Runoff, m3/s Hour Base Flow, m3.s 0 0 0 6 120 120 17 120 12 250 36 18 400 140 260 56 24 550 150 30 50 520 160 360 36 470 170 300 42 180 160 22 48 254 190 64 19 9 0 54 200 200 0 60 190 190 0 0 Totals 3294 1630 1664 231.5