Page 1 of 1
Figure Q1 shows a soil profile. An oedometer test was conducted on a specimen collected from the middle of the clay laye
Posted: Thu Apr 28, 2022 3:37 pm
by answerhappygod
- Figure Q1 Shows A Soil Profile An Oedometer Test Was Conducted On A Specimen Collected From The Middle Of The Clay Laye 1 (103.83 KiB) Viewed 26 times
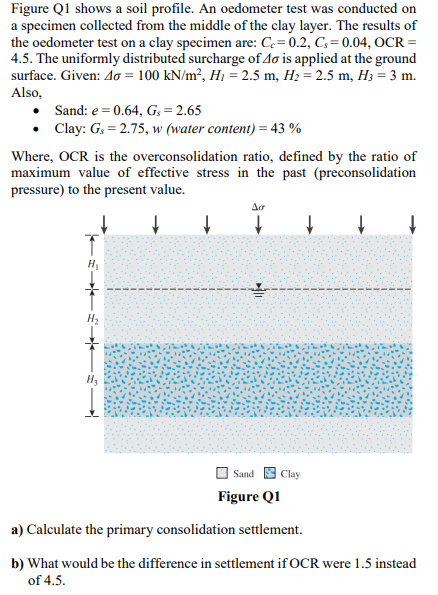
Figure Q1 shows a soil profile. An oedometer test was conducted on a specimen collected from the middle of the clay layer. The results of the oedometer test on a clay specimen are: Ce=0.2, Cs=0.04, OCR = 4.5. The uniformly distributed surcharge of do is applied at the ground surface. Given: 40 = 100 kN/m², H, = 2.5 m, H2 = 2.5 m, H3 = 3 m. Also, Sand: e=0.64, Gs = 2.65 Clay: Gs = 2.75, w (water content) = 43% Where, OCR is the overconsolidation ratio, defined by the ratio of maximum value of effective stress in the past (preconsolidation pressure) to the present value. + Δα H2 HE Sand Clay Figure Q1 a) Calculate the primary consolidation settlement. b) What would be the difference in settlement if OCR were 1.5 instead of 4.5.