Page 1 of 1
e Figure QI shows a soil profile. An oedometer test was conducted on a specimen collected from the middle of the clay la
Posted: Thu Apr 28, 2022 3:36 pm
by answerhappygod
- E Figure Qi Shows A Soil Profile An Oedometer Test Was Conducted On A Specimen Collected From The Middle Of The Clay La 1 (48.52 KiB) Viewed 29 times
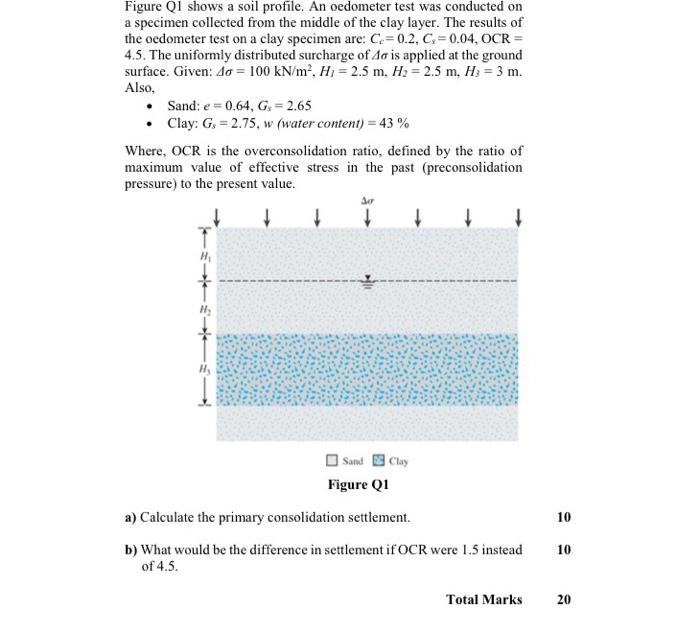
e Figure QI shows a soil profile. An oedometer test was conducted on a specimen collected from the middle of the clay layer. The results of the oedometer test on a clay specimen are: Ce=0.2, C=0.04, OCR = 4.5. The uniformly distributed surcharge of Ao is applied at the ground surface. Given: 40 = 100 kN/m², H7 = 2.5 m, H2 = 2.5 m, H: = 3 m. Also, Sand: e=0.64, G. = 2.65 • Clay: G= 2.75, w (water content) = 43% Where, OCR is the overconsolidation ratio, defined by the ratio of maximum value of effective stress in the past (preconsolidation pressure) to the present value. + + sur Sand Clay Figure Q1 a) Calculate the primary consolidation settlement. b) What would be the difference in settlement if OCR were 1.5 instead of 4.5. 10 10 Total Marks 20