Page 1 of 1
Question 2 Figure 2 shows the values of grid spot heights obtained during a level survey. The aren outlined in bold is t
Posted: Thu Apr 28, 2022 3:20 pm
by answerhappygod
- Question 2 Figure 2 Shows The Values Of Grid Spot Heights Obtained During A Level Survey The Aren Outlined In Bold Is T 1 (27.34 KiB) Viewed 22 times
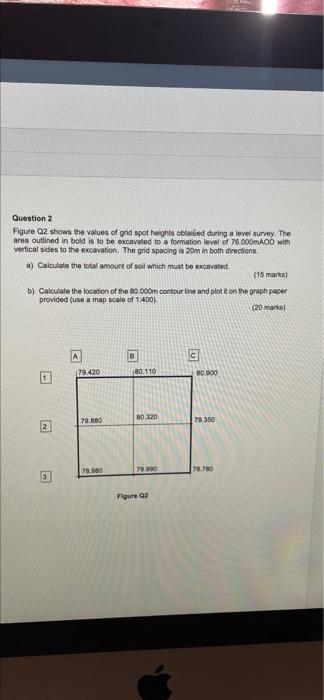
Question 2 Figure 2 shows the values of grid spot heights obtained during a level survey. The aren outlined in bold is to be excavated to a formation level of 76.000mAOD with vertical sides to the excavation. The gnd spacing is 20m in both directions a) Calculate the total amount of soil which must be excavated (15 manas) b) Calculate the location of the 80.000m contour line and plot it on the graph paper provided (use a map scale of 1400) (20 mark) A 6 c 79 420 180.110 6000 79.850 60.320 70.350 2 78.00 27900 78780 Flores