I only need help on "Table A2. Dairy assessment cash flows and
cash revenue projections for milk expansion"
- I Only Need Help On Table A2 Dairy Assessment Cash Flows And Cash Revenue Projections For Milk Expansion 1 (97.83 KiB) Viewed 29 times
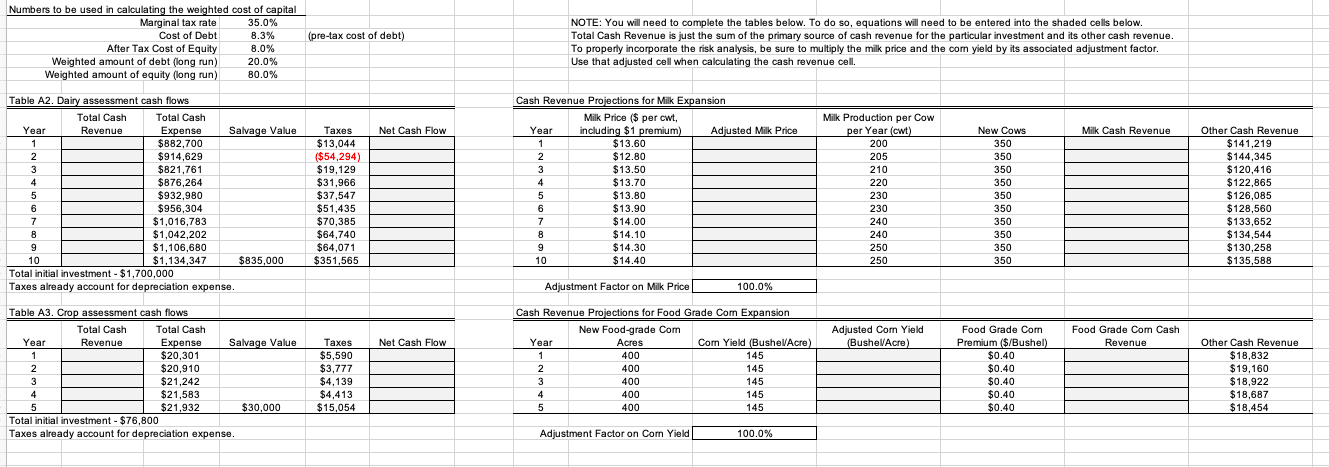
(pre-tax cost of debt) Numbers to be used in calculating the weighted cost of capital Marginal tax rate 35.0% Cost of Debt 8.3% After Tax Cost of Equity 8.0% Weighted amount of debt (long run) 20.0% Weighted amount of equity (long run) 80.0% NOTE: You will need to complete the tables below. To do so, equations will need to be entered into the shaded cells below. Total Cash Revenue is just the sum of the primary source of cash revenue for the particular investment and its other cash revenue. To properly incorporate the risk analysis, be sure to multiply the milk price and the corn yield by its associated adjustment factor. Use that adjusted cell when calculating the cash revenue cell. Net Cash Flow Milk Cash Revenue Table A2. Dairy assessment cash flows Total Cash Total Cash Year Revenue Expense Salvage Value 1 $882,700 2 2 $914,629 3 $821,761 4 $876,264 5 $932,980 6 $956,304 7 $1,016,783 8 $1,042,202 9 $1,106,680 10 $1,134,347 $835,000 Total initial investment - $1,700,000 Taxes already account for depreciation expense. Taxes $13,044 ($54,294) $19,129 $31,966 $37,547 $51,435 $70,385 $64,740 $64,071 $351,565 Cash Revenue Projections for Milk Expansion Milk Price ($ per cwt, Year including $1 premium) Adjusted Milk Price 1 $13.60 2 $12.80 3 $13.50 4 $13.70 5 $13.80 6 $13.90 7 $14.00 8 $14.10 9 $14.30 10 $14.40 Milk Production per Cow per Year (cwt) 200 205 210 220 230 230 240 240 250 250 New Cows 350 350 350 350 350 350 350 350 350 350 Other Cash Revenue $141,219 $144,345 $120,416 $122,865 $126,085 $128,560 $133,652 $134,544 $130,258 $135,588 Adjustment Factor on Milk Price 100.0% Adjusted Com Yield (BushelAcre) Food Grade Com Cash Revenue Net Cash Flow Table A3. Crop assessment cash flows Total Cash Total Cash Year Revenue Expense Salvage Value 1 1 $20,301 2 $20,910 3 $21,242 4 $21,583 5 $21,932 $30,000 Total initial investment - $76,800 Taxes already account for depreciation expense. Taxes $5,590 $3,777 $4,139 $4,413 $15,054 Cash Revenue Projections for Food Grade Com Expansion New Food-grade Com Year Acres Com Yield (BushelAcre 1 400 145 2 400 145 3 400 145 4 400 145 5 400 145 Food Grade Com Premium ($/Bushel) $0.40 $0.40 $0.40 $0.40 $0.40 Other Cash Revenue $18,832 $19,160 $18,922 $18,687 $18.454 Adjustment Factor on Com Yield 100.0%
Table A2. Dairy assessment cash flows Year Cash Revenue 1 $1,093,219 2 $1,062,745 3 $1,112,666 4 $1,177,765 5 $1,236,985 $1,247,510 7 $1,309,652 $1,318,944 9 $1,381,508 10 $1,395,588 Cash Expense Salvage Value $882,700 $914,629 $821,761 $876,264 $932,980 $956,304 $1,016,783 $1,042,202 $1,106,680 $1,134,347 $835,000 Van Taxes $13,044 ($54,294) $19,129 $31,966 $37,547 $51,435 $70,385 $64,740 $64,071 $351,565 Net Cash Flow $197,475 202,409 271,776 269,534 266,458 239,771 222,484 212,002 210,758 744,676 6 8 Note: The negative $54,294 in year two represents the savings in income taxes that arises because the taxable expense for this enterprise exceed the taxable income. This tax savings assumes there is sufficient income from other sources to offset the negative taxable income from this enterprise. influenced her thinking and led to the projections that appear in tables A1 and A2. Variable expenses, apart from the cost of raising replacements, are about $8 per cwt of milk produced. Half of the $8 represents feed costs paid to the grain operation for hay, corn, and corn silage. In her analysis, Betty assumed inflation will average 2.5%. MBC Farms uses 12.3% (8.0% after tax) as its cost of equity capital provided for any project. Their estimated tax rate is 35%. After visiting with a number of lenders, Betty expects to be able to find financing for 80% of the capital costs of the proposed expansion. The lenders told her to expect a repayment period of approximately ten years and an interest rate around 8.3%. MBC Farms will need to determine whether this financing is feasible given the farm's financial condition.