Page 1 of 1
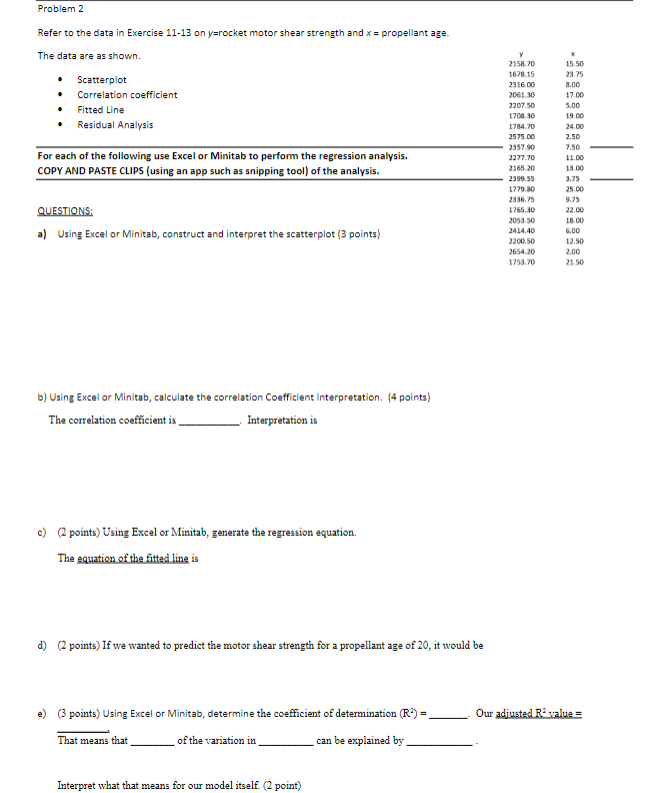
Problem 2 Refer to the data in Exercise 11-13 on y-rocket motor shear strength and x = propellant age. The data are as s
Posted: Thu Apr 28, 2022 7:21 am
by answerhappygod
- Problem 2 Refer To The Data In Exercise 11 13 On Y Rocket Motor Shear Strength And X Propellant Age The Data Are As S 1 (63.79 KiB) Viewed 31 times
Problem 2 Refer to the data in Exercise 11-13 on y-rocket motor shear strength and x = propellant age. The data are as shown. Scatterplot • Correlation coefficient Fitted Line Residual Analysis 15.50 28.75 8.00 17.00 5.00 19.00 24.00 2.50 For each of the following use Excel or Minitab to perform the regression analysis. COPY AND PASTE CLIPS (using an app such as snipping tool) of the analysis. V 2158.70 1678.15 2316.00 2061.30 2207.50 1708.30 1784.70 2575.00 2357.90 2277.70 2165.20 2399.55 1779.80 2336.75 1765.30 2053.50 2414.40 2200.50 2654,20 1753.70 QUESTIONS: a) Using Excel or Minitab, construct and interpret the scatterplot (3 points) 7.50 11.00 13.00 3.75 25.00 9.75 22.00 18.00 6.00 12.50 2.00 21.50 b) Using Excel or Minitab, calculate the correlation coefficient Interpretation. (4 points) The correlation coefficient is Interpretation is c) (2 points) Using Excel or Minitab, generate the regression equation. The equation of the fitted line is d) (2 points) If we wanted to predict the motor shear strength for a propellant age of 20, it would be Our adiusted R value= e) (3 points) Using Excel or Minitab, determine the coefficient of determination (R-) = of the variation in can be explained by That means that Interpret what that means for our model itself. 2 point)
Residual Plot Interpretation. Using Excel or Minitab, construct the residual plots. Interpret each plot. (3 points each) ) Plot 1) Normal probability plot. 3) Plot 2) Histogram. h) Plot 3) Versus Fits. 1) Plot 4) Versus Order. 1) Overall concluding comments about model. points)