- 1 14 Pts True False Circle True If The Statement Is True Circle False If The Statement Is False True False The P V 1 (124.98 KiB) Viewed 35 times
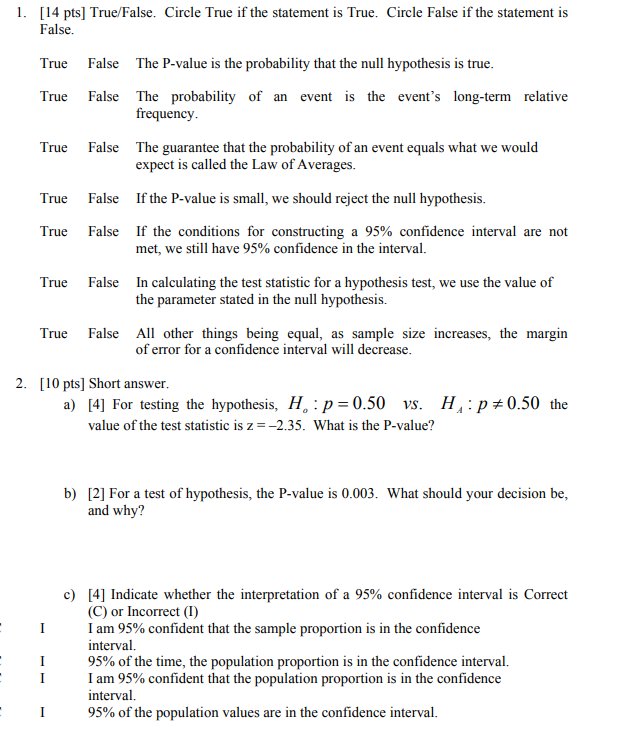
1. [14 pts] True/False. Circle True if the statement is True. Circle False if the statement is False. True False The P-value is the probability that the null hypothesis is true. True False The probability of an event is the event's long-term relative frequency. True False The guarantee that the probability of an event equals what we would expect is called the Law of Averages. True False If the P-value is small, we should reject the null hypothesis. True False If the conditions for constructing a 95% confidence interval are not met, we still have 95% confidence in the interval. True False In calculating the test statistic for a hypothesis test, we use the value of the parameter stated in the null hypothesis. True False All other things being equal, as sample size increases, the margin of error for a confidence interval will decrease. 2. [10 pts] Short answer. a) [4] For testing the hypothesis, H, : p=0.50 vs. H.

+0.50 the value of the test statistic is z=-2.35. What is the P-value? b) [2] For a test of hypothesis, the P-value is 0.003. What should your decision be, and why? c) [4] Indicate whether the interpretation of a 95% confidence interval is Correct (C) or Incorrect (1) I am 95% confident that the sample proportion is in the confidence interval. 95% of the time, the population proportion is in the confidence interval. I am 95% confident that the population proportion is in the confidence interval. 95% of the population values are in the confidence interval. I I I
3. [14 pts] Consider the population of all ISU Stat 101 students who have responded to the beginning of the semester survey. There are over 1,400 students in this population. For this population, the proportion of students whose hometown is less than 50 miles from Ames is 0.24. a) [4] For random samples of 50 students taken from this population, describe the sampling distribution of Ộ, the sample proportion of students whose hometown is less than 50 miles from Ames. Be sure to include shape, center and spread. b) [2] Is the 10% condition satisfied? Explain briefly. c) [3] Is the success/failure condition satisfied? Explain briefly. d) [5] What is the probability that a random sample of 50 students taken from this population will have 20 or more students whose hometown is less than 50 miles from Ames?