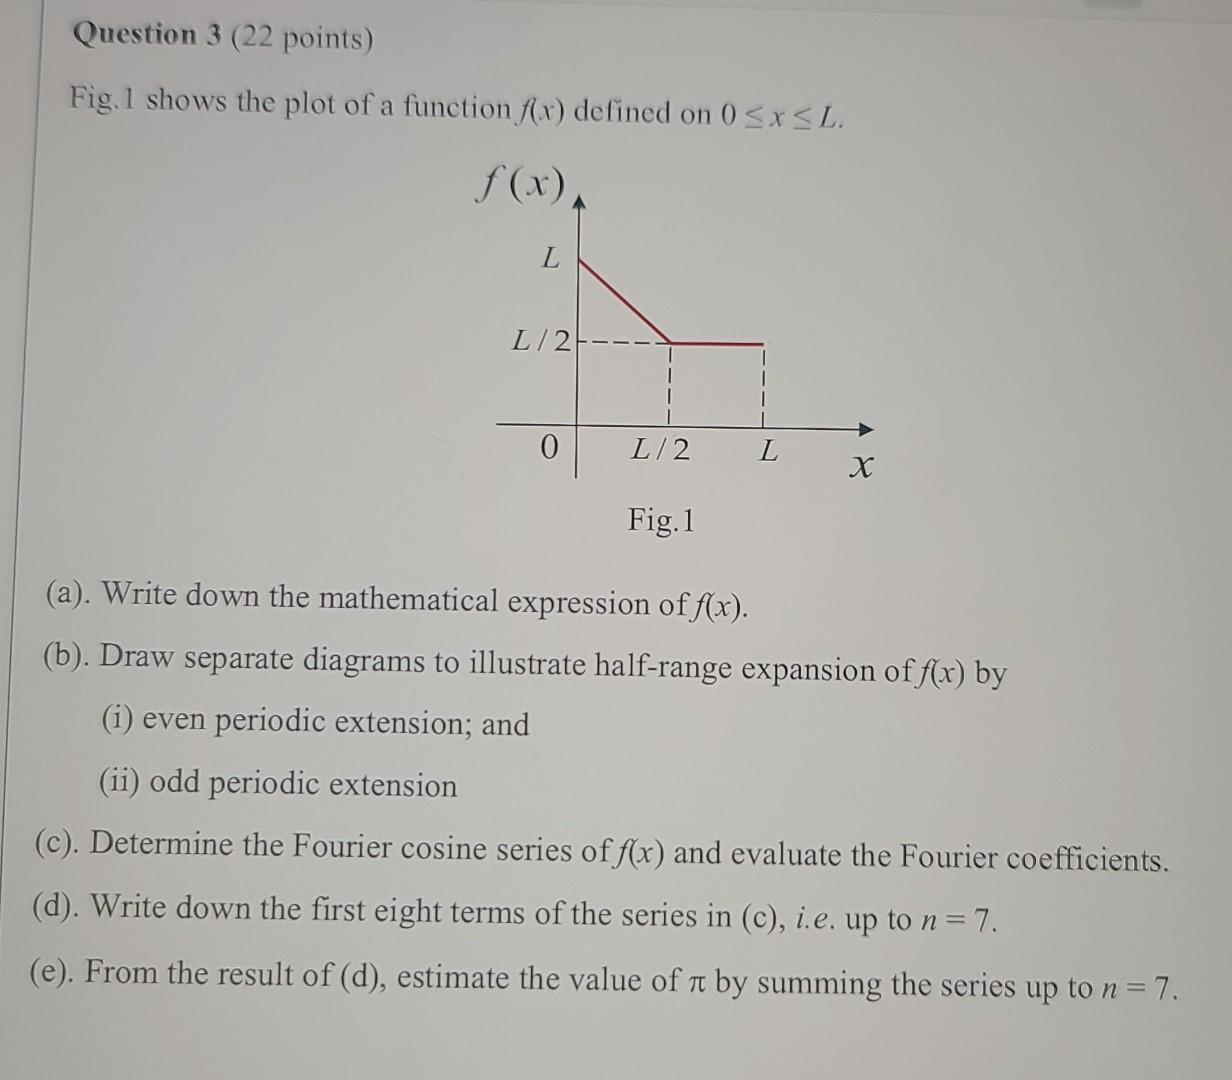
Question 3 (22 points) Fig. 1 shows the plot of a function f(x) defined on 0 < x
Posted: Thu Apr 28, 2022 6:40 am
- 1 (77.21 KiB) Viewed 30 times
Question 3 (22 points) Fig. 1 shows the plot of a function f(x) defined on 0 < x <L. f(x) L L/2 0 L/2 L х Fig. 1 (a). Write down the mathematical expression of f(x). (b). Draw separate diagrams to illustrate half-range expansion of f(x) by (i) even periodic extension, and (ii) odd periodic extension (c). Determine the Fourier cosine series of f(x) and evaluate the Fourier coefficients. (d). Write down the first eight terms of the series in (c), i.e. up to n = 7. (e). From the result of (d), estimate the value of it by summing the series up to n= 7.
Posted: Thu Apr 28, 2022 6:40 am
- 1 (77.21 KiB) Viewed 30 times