Page 1 of 1
The two micrographs below show a small part of a fracture surface taken in a scanning electron microscope. The two mater
Posted: Wed Apr 27, 2022 7:40 pm
by answerhappygod
- The Two Micrographs Below Show A Small Part Of A Fracture Surface Taken In A Scanning Electron Microscope The Two Mater 1 (497.01 KiB) Viewed 25 times
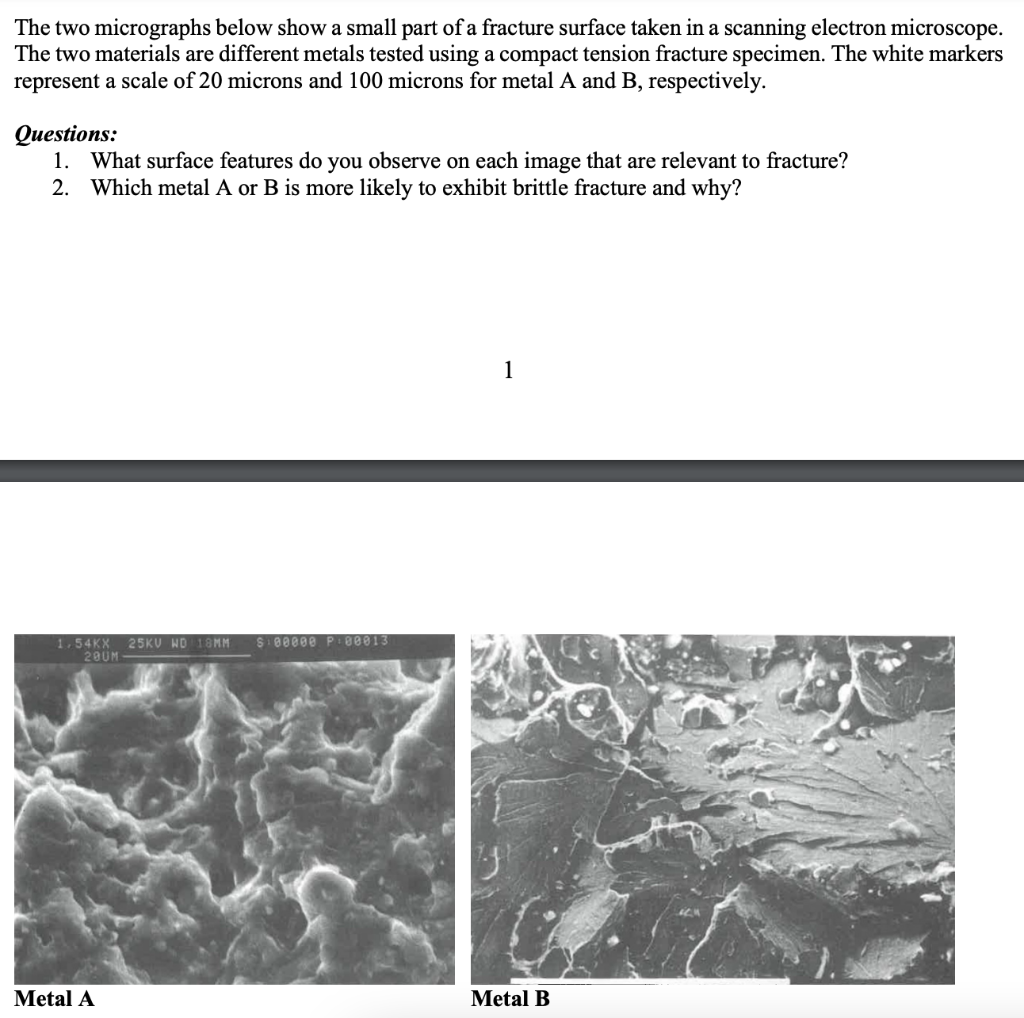
The two micrographs below show a small part of a fracture surface taken in a scanning electron microscope. The two materials are different metals tested using a compact tension fracture specimen. The white markers represent a scale of 20 microns and 100 microns for metal A and B, respectively. Questions: 1. What surface features do you observe on each image that are relevant to fracture? 2. Which metal A or B is more likely to exhibit brittle fracture and why? 1 SBBBBB PIB0813 1.54KX 25KV HD 18MM 200M Metal A Metal B