Page 1 of 1
Q3. (a) The Bode plot of a linear system is given in Figure Q3a. 10-1 50 10° 101 102 103 104 0 -50 Magnitude (dB) -100 -
Posted: Wed Apr 27, 2022 5:53 pm
by answerhappygod
- Q3 A The Bode Plot Of A Linear System Is Given In Figure Q3a 10 1 50 10 101 102 103 104 0 50 Magnitude Db 100 1 (164.37 KiB) Viewed 30 times
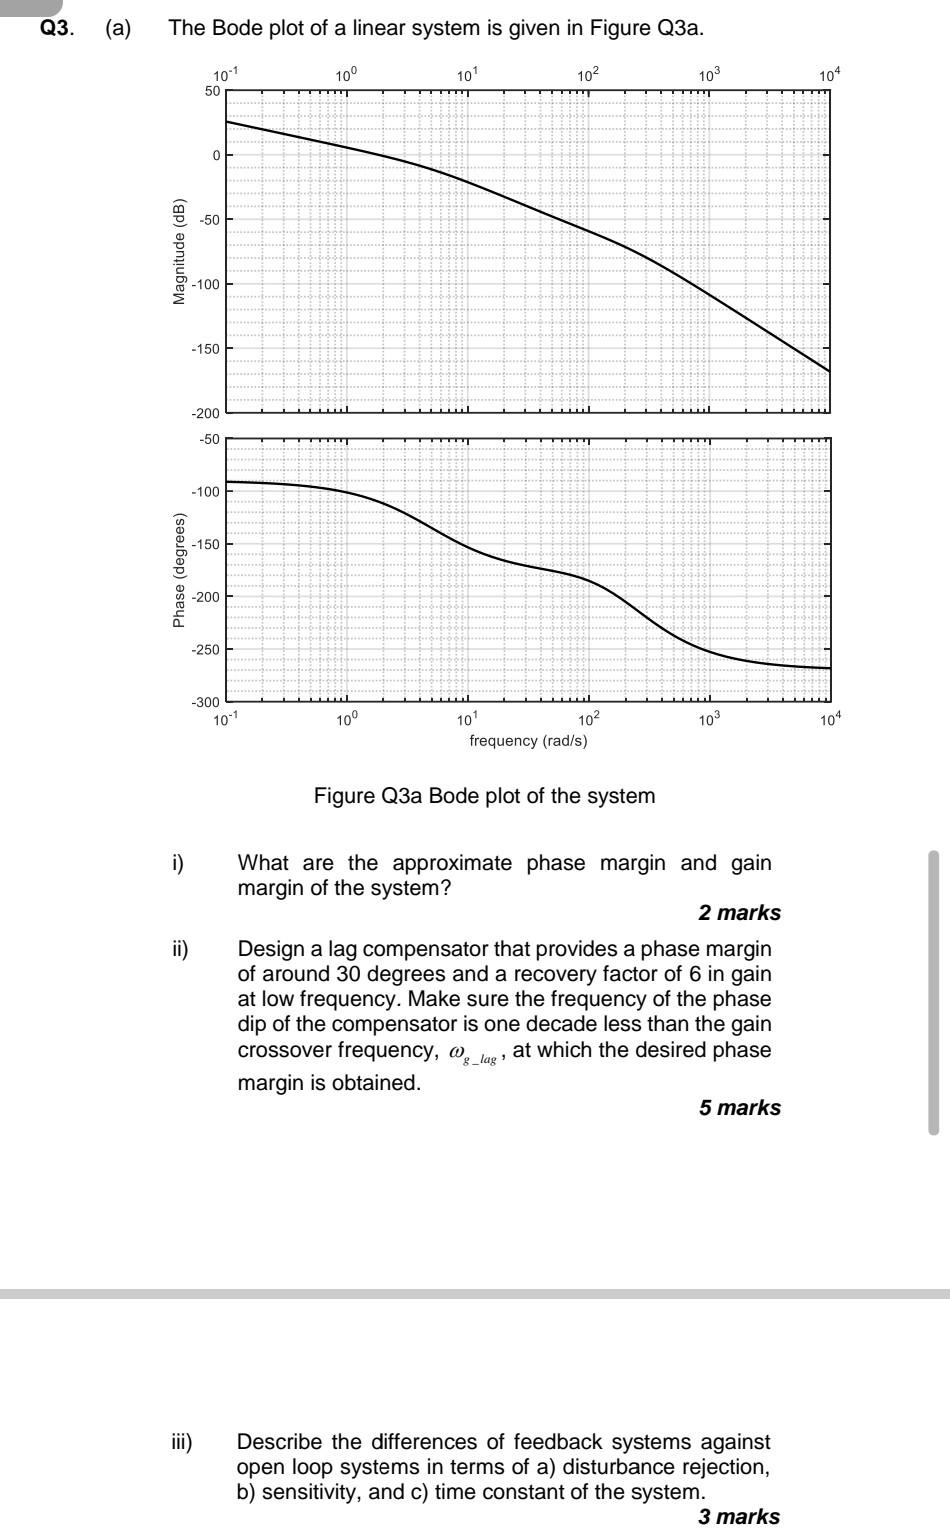
Q3. (a) The Bode plot of a linear system is given in Figure Q3a. 10-1 50 10° 101 102 103 104 0 -50 Magnitude (dB) -100 - 150 -200 ليبيتلل للبلاد -50 TITIT -100 -150 Phase (degrees) -200 -250 -300 10-1 100 103 104 101 102 frequency (rad/s) Figure Q3a Bode plot of the system i) ii) What are the approximate phase margin and gain margin of the system? 2 marks Design a lag compensator that provides a phase margin of around 30 degrees and a recovery factor of 6 in gain at low frequency. Make sure the frequency of the phase dip of the compensator is one decade less than the gain crossover frequency, o, at which the desired phase g_lag margin is obtained. 5 marks iii) Describe the differences of feedback systems against open loop systems in terms of a) disturbance rejection, b) sensitivity, and c) time constant of the system. 3 marks