Page 1 of 1
1. The following table shows plasma concentrations following a single 500 mg IV dose of drug A and drug B. Time (h) 2 4
Posted: Tue Sep 07, 2021 8:19 am
by answerhappygod
- 1 The Following Table Shows Plasma Concentrations Following A Single 500 Mg Iv Dose Of Drug A And Drug B Time H 2 4 1 (62.92 KiB) Viewed 215 times
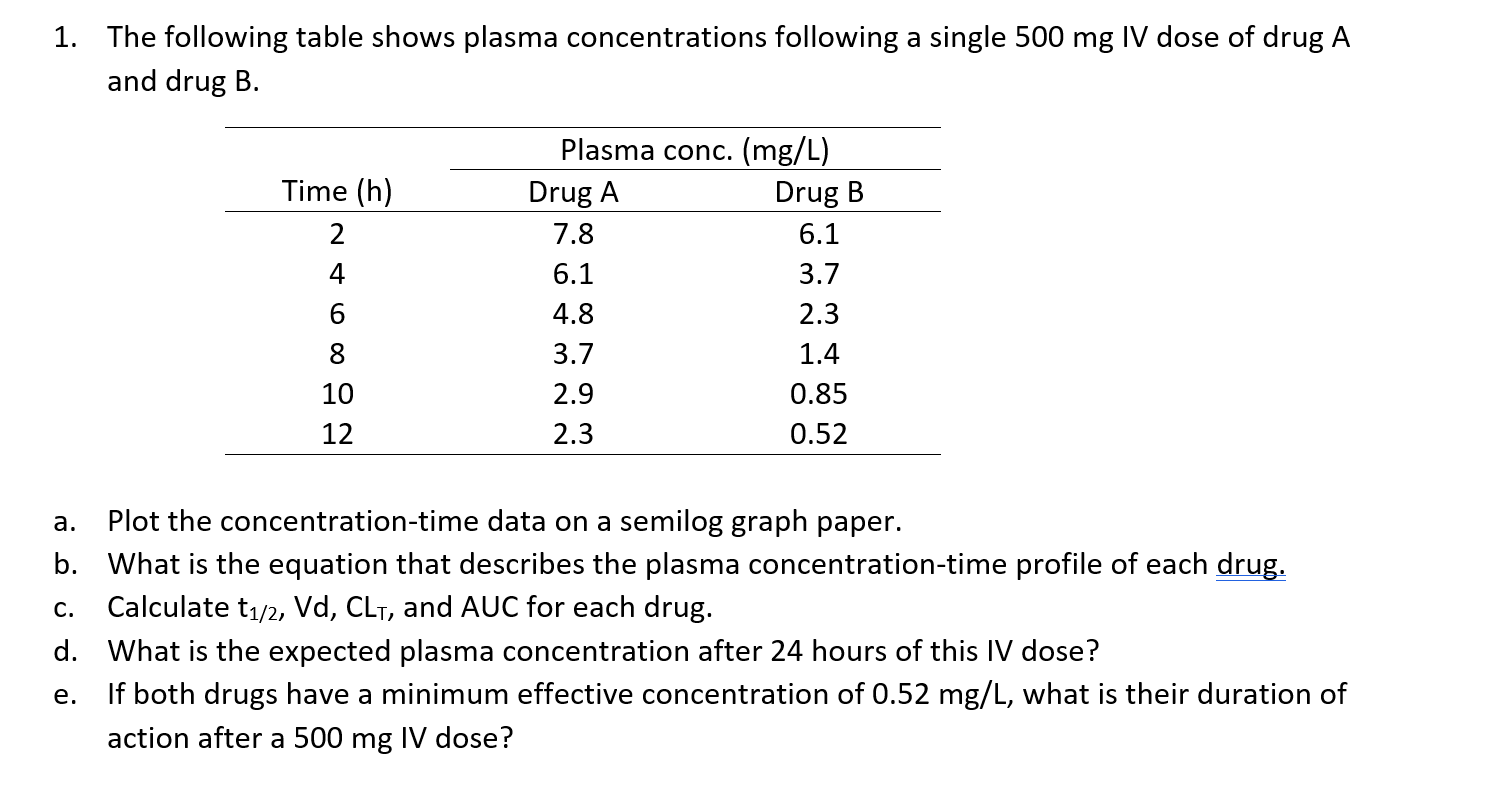
1. The following table shows plasma concentrations following a single 500 mg IV dose of drug A and drug B. Time (h) 2 4 Plasma conc. (mg/L) Drug A Drug B 7.8 6.1 6.1 3.7 4.8 2.3 3.7 1.4 2.9 0.85 2.3 0.52 6 10 12 a. C. Plot the concentration-time data on a semilog graph paper. b. What is the equation that describes the plasma concentration-time profile of each drug. Calculate t1/2, Vd, CLT, and AUC for each drug. d. What is the expected plasma concentration after 24 hours of this IV dose? If both drugs have a minimum effective concentration of 0.52 mg/L, what is their duration of action after a 500 mg IV dose? e.