Page 1 of 1
r=4%, Y=3,000 5. The graph below shows the Fed rule curve and the current equilibrium of an economy in which -P is fixed
Posted: Wed Apr 27, 2022 12:24 pm
by answerhappygod
- R 4 Y 3 000 5 The Graph Below Shows The Fed Rule Curve And The Current Equilibrium Of An Economy In Which P Is Fixed 1 (188.95 KiB) Viewed 29 times
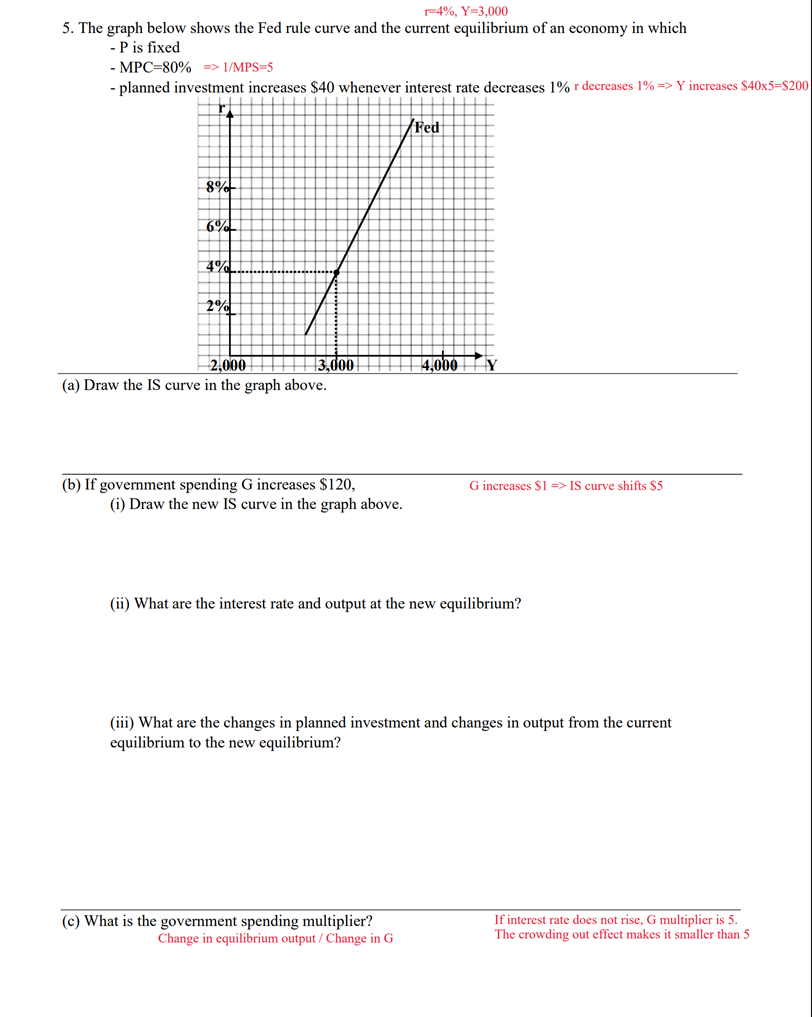
r=4%, Y=3,000 5. The graph below shows the Fed rule curve and the current equilibrium of an economy in which -P is fixed - MPC=80% => 1/MPS=5 - planned investment increases $40 whenever interest rate decreases 1%r decreases 1% => Y increases $40x5=$200 Fed 8% 6% 4% 2% 4,000 Y 2,000 3,000 (a) Draw the IS curve in the graph above. G increases $1 => IS curve shifts $5 (b) If government spending G increases $120, (i) Draw the new IS curve in the graph above. (ii) What are the interest rate and output at the new equilibrium? (iii) What are the changes in planned investment and changes in output from the current equilibrium to the new equilibrium? (c) What is the government spending multiplier? Change in equilibrium output / Change in G If interest rate does not rise, G multiplier is 5. The crowding out effect makes it smaller than 5