Page 1 of 1
1. Use the following graph to answer this exercise. Suppose the economy is initially at a full employment GDP of $40 bil
Posted: Wed Apr 27, 2022 12:21 pm
by answerhappygod
- 1 Use The Following Graph To Answer This Exercise Suppose The Economy Is Initially At A Full Employment Gdp Of 40 Bil 1 (131.61 KiB) Viewed 35 times
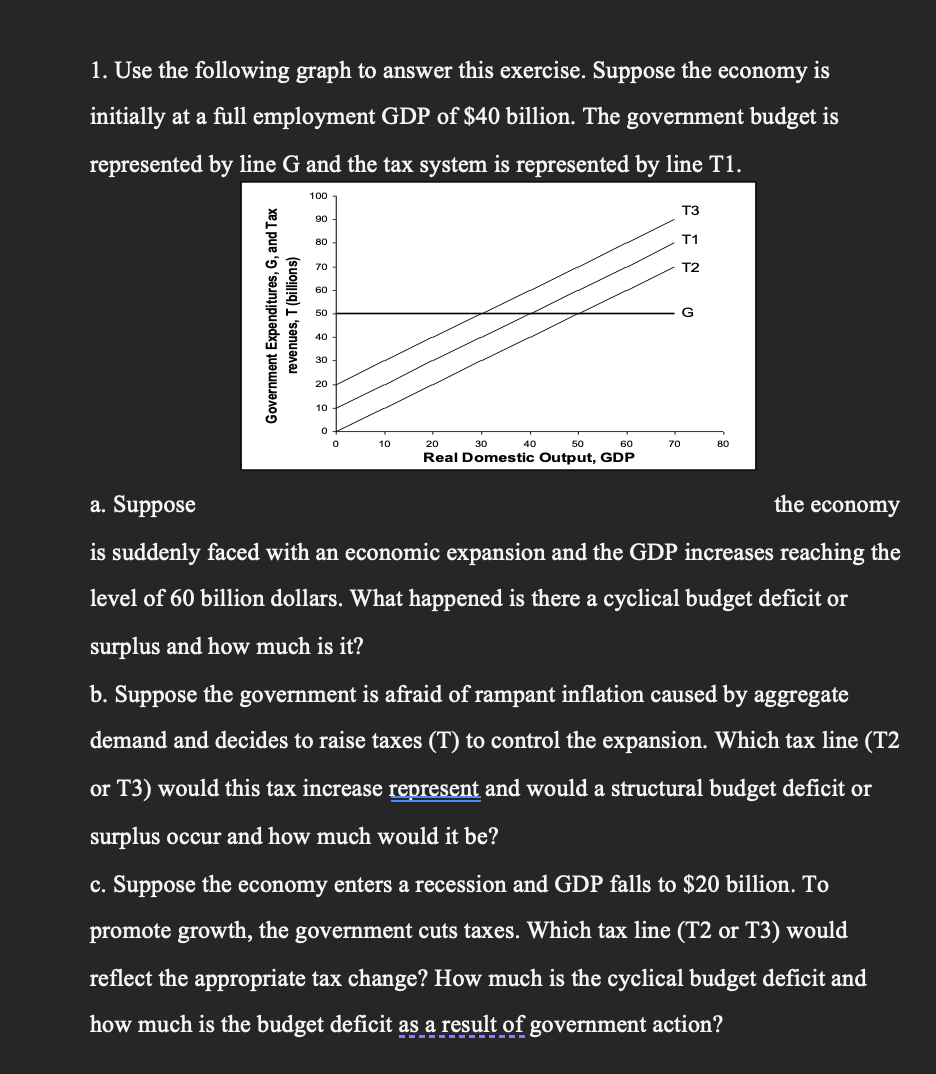
1. Use the following graph to answer this exercise. Suppose the economy is initially at a full employment GDP of $40 billion. The government budget is represented by line G and the tax system is represented by line Ti. 100 T3 90 80 T1 70 T2 60 Government Expenditures, G, and Tax revenues, T (billions) 50 G 40 30 20 10 0 0 10 30 40 50 60 70 80 20 Real Domestic Output, GDP a. Suppose the economy is suddenly faced with an economic expansion and the GDP increases reaching the level of 60 billion dollars. What happened is there a cyclical budget deficit or surplus and how much is it? b. Suppose the government is afraid of rampant inflation caused by aggregate demand and decides to raise taxes (T) to control the expansion. Which tax line (T2 or T3) would this tax increase represent and would a structural budget deficit or surplus occur and how much would it be? c. Suppose the economy enters a recession and GDP falls to $20 billion. To promote growth, the government cuts taxes. Which tax line (T2 or T3) would reflect the appropriate tax change? How much is the cyclical budget deficit and how much is the budget deficit as a result of government action?