- Consider The Solow Growth Model Discussed In Class Suppose That The Production Function In A Specific Period Is Given B 1 (81.37 KiB) Viewed 46 times
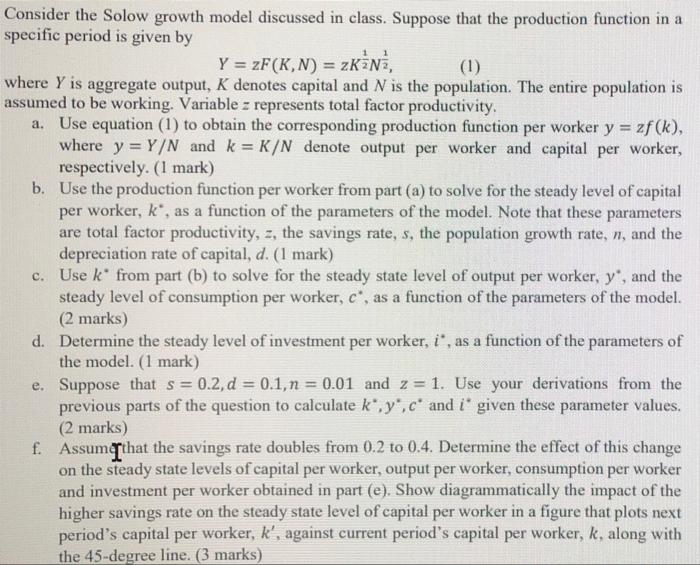
Consider the Solow growth model discussed in class. Suppose that the production function in a specific period is given by Y = zF(K, N) = ZKZN, (1) where Y is aggregate output, K denotes capital and N is the population. The entire population is assumed to be working. Variable z represents total factor productivity, a. Use equation (1) to obtain the corresponding production function per worker y = zf (k), where y = Y/N and k = K/N denote output per worker and capital per worker, respectively. (1 mark) b. Use the production function per worker from part (a) to solve for the steady level of capital per worker, k*, as a function of the parameters of the model. Note that these parameters are total factor productivity, z, the savings rate, s, the population growth rate, n, and the depreciation rate of capital, d. (1 mark) c. Use k* from part (b) to solve for the steady state level of output per worker, y", and the steady level of consumption per worker, c", as a function of the parameters of the model. (2 marks) d. Determine the steady level of investment per worker, i", as a function of the parameters of the model. (1 mark) e. Suppose that s = 0.2, d = 0.1, n = 0.01 and 2 = 1. Use your derivations from the previous parts of the question to calculate k*,y,c* and i' given these parameter values. (2 marks) f. Assume that the savings rate doubles from 0.2 to 0.4. Determine the effect of this change on the steady state levels of capital per worker, output per worker, consumption per worker and investment per worker obtained in part (e). Show diagrammatically the impact of the higher savings rate on the steady state level of capital per worker in a figure that plots next period's capital per worker, k', against current period's capital per worker, k, along with the 45-degree line. (3 marks)