Page 1 of 1
Part A: Quantitative colours 1. Place a white card in the light path of the spectrophotometer provided. 2. Using the wav
Posted: Wed Apr 27, 2022 6:26 am
by answerhappygod
- Part A Quantitative Colours 1 Place A White Card In The Light Path Of The Spectrophotometer Provided 2 Using The Wav 1 (78.21 KiB) Viewed 29 times
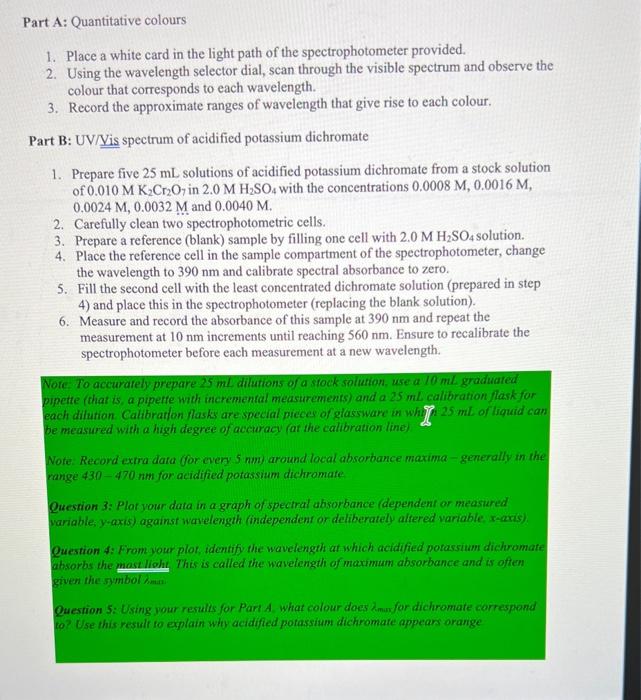
Part A: Quantitative colours 1. Place a white card in the light path of the spectrophotometer provided. 2. Using the wavelength selector dial, scan through the visible spectrum and observe the colour that corresponds to each wavelength. 3. Record the approximate ranges of wavelength that give rise to each colour. Part B: UV/Vis spectrum of acidified potassium dichromate 1. Prepare five 25 mL solutions of acidified potassium dichromate from a stock solution of 0.010 M K2Cr2O7 in 2.0 M H2SO4 with the concentrations 0.0008 M, 0.0016 M, 0.0024 M, 0.0032 M and 0.0040 M. 2. Carefully clean two spectrophotometric cells. 3. Prepare a reference (blank) sample by filling one cell with 2.0 M H2SO4 solution. 4. Place the reference cell in the sample compartment of the spectrophotometer, change the wavelength to 390 nm and calibrate spectral absorbance to zero. 5. Fill the second cell with the least concentrated dichromate solution (prepared in step 4) and place this in the spectrophotometer (replacing the blank solution). 6. Measure and record the absorbance of this sample at 390 nm and repeat the measurement at 10 nm increments until reaching 560 nm. Ensure to recalibrate the spectrophotometer before each measurement at a new wavelength. Note To accurately prepare 25 mL dilutions of a stock solution, use a 10 ml. graduated pipette (that is, a pipette with incremental measurements) and a 25 ml calibration flask for each dilution. Calibration flasks are special pieces of glassware in why 25 ml of liquid can be measured with a high degree of accuracy (at the calibration line) Note Record extra data (for every 5 nm) around local absorbance maxima - generally in the range 430 - 470 nm for acidified potassium dichromate Question 3: Plot your data in a graph of spectral absorbance (dependent or measured variable, y-axis) against wavelength (independent or deliberately altered variable t-axis) Question 4: From your plor, identify the wavelength at which acidified potassium dichromate absorbs the most light. This is called the wavelength of maximum absorbance and is often given the symbolmin Question 5: Using your results for Part A what colour does muy for dichromate correspond to? Use this result to explain why acidified potassium dichromate appears orange