Page 1 of 1
FIGURE 6 illustrates molecular distribution when a sound propagates in the air. Choose the FAI SE statements. riern nor,
Posted: Fri Jul 15, 2022 8:24 am
by answerhappygod
- Figure 6 Illustrates Molecular Distribution When A Sound Propagates In The Air Choose The Fai Se Statements Riern Nor 1 (160.01 KiB) Viewed 41 times
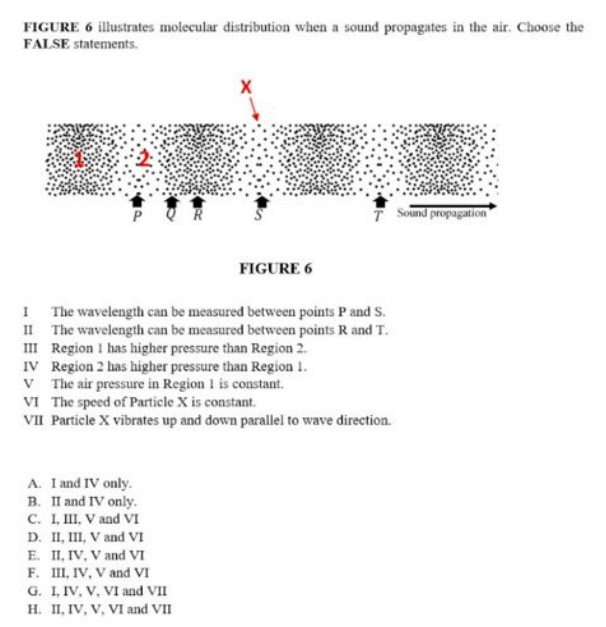
FIGURE 6 illustrates molecular distribution when a sound propagates in the air. Choose the FAI SE statements. riern nor, 0 I The wavelength can be measured between points P and S. II The wavelength can be measured between points R and T. III Region I has higher pressure than Region 2 . IV Region 2 has higher pressure than Region 1 . V The air pressure in Region 1 is constant. VI The speed of Particle X is constant. VII Particle X vibrates up and down parallel to wave direction.