Page 1 of 1
27 The table below shows a partial computer output for a real estate data for 50 residences that we wish to determine ho
Posted: Tue Apr 26, 2022 6:17 pm
by answerhappygod
- 27 The Table Below Shows A Partial Computer Output For A Real Estate Data For 50 Residences That We Wish To Determine Ho 1 (57.57 KiB) Viewed 37 times
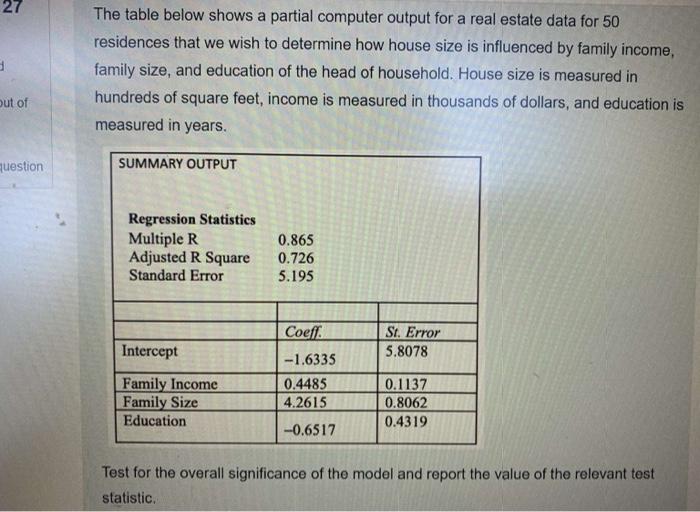
27 The table below shows a partial computer output for a real estate data for 50 residences that we wish to determine how house size is influenced by family income, family size, and education of the head of household. House size is measured in hundreds of square feet, income is measured in thousands of dollars, and education is measured in years. out of question SUMMARY OUTPUT Regression Statistics Multiple R Adjusted R Square Standard Error 0.865 0.726 5.195 Coef St. Error 5.8078 Intercept Family Income Family Size Education -1.6335 0.4485 4.2615 0.1137 0.8062 0.4319 -0.6517 Test for the overall significance of the model and report the value of the relevant test statistic.