Page 1 of 1
Given below is the data from 10 samples of 4 items each. In addition, the mean (xˉ), range (R), and proportion (p^) of
Posted: Thu Jul 14, 2022 4:52 pm
by answerhappygod
- 1 (196.68 KiB) Viewed 38 times
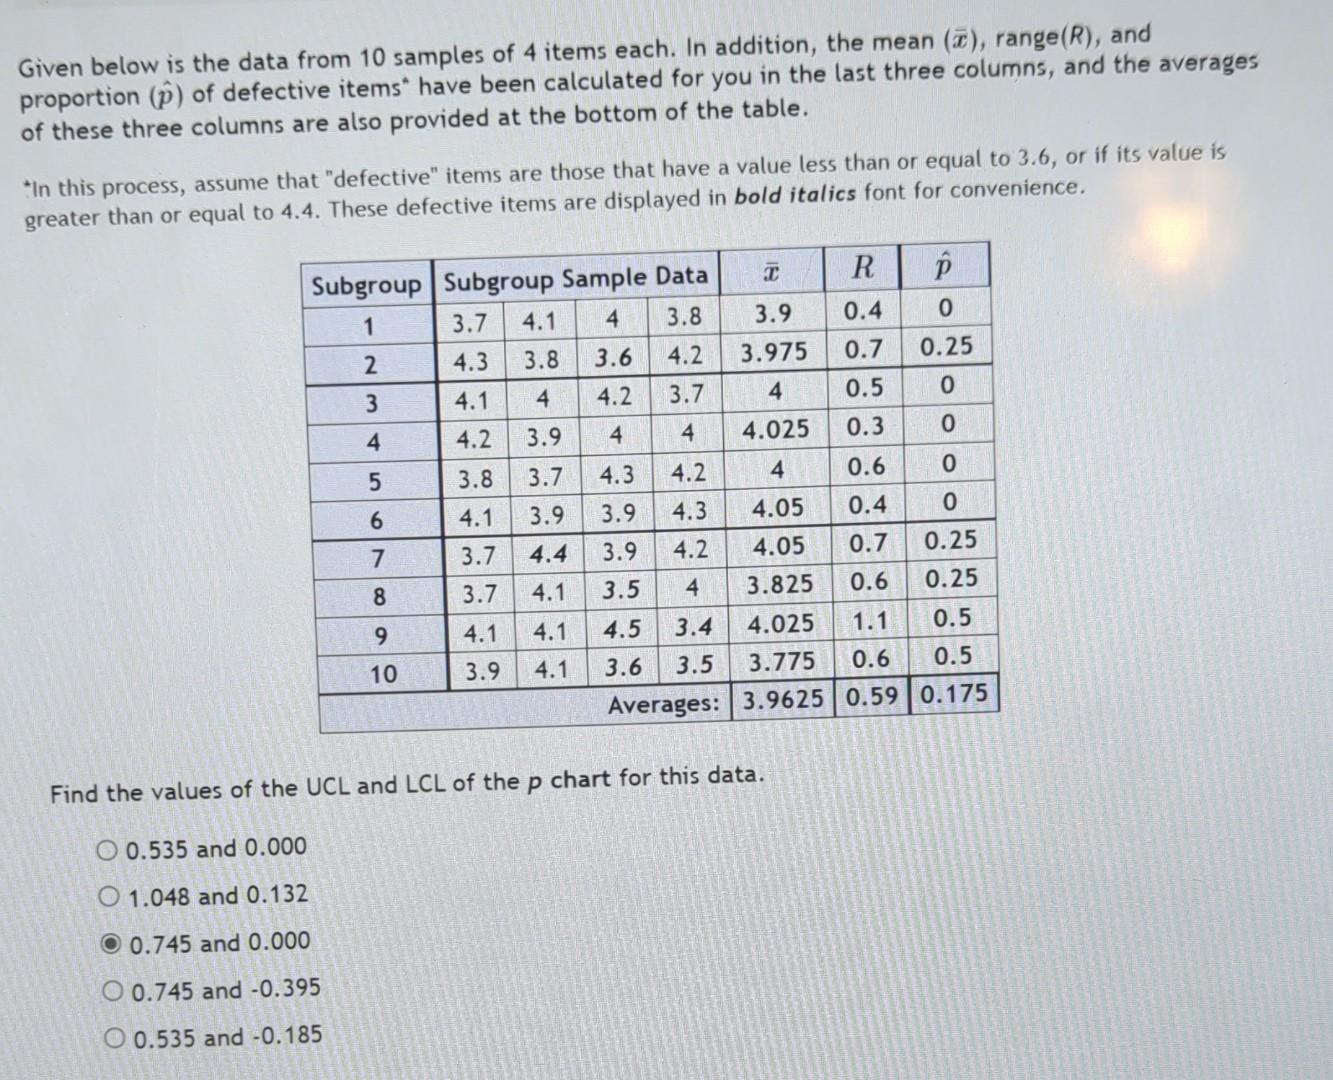
Given below is the data from 10 samples of 4 items each. In addition, the mean (xˉ), range (R), and proportion (p^) of defective items" have been calculated for you in the last three columns, and the averages of these three columns are also provided at the bottom of the "In this process, assume that "defective" items are those that have a value less than or equal to 3.6, or if its value is greater than or equal to 4.4. These defective items are displayed in bold italics font for convenience. Find the values of the UCL and LCL of the p chart for this data. 0.535 and 0.000 1.048 and 0.132 0.745 and 0.000 0.745 and −0.395 0.535 and −0.185