Page 1 of 1
The figure shows the temperature values (in ∘F) on a typical May day in a certain Midwiestern city. The equation of the
Posted: Thu Jul 14, 2022 4:47 pm
by answerhappygod
- The Figure Shows The Temperature Values In F On A Typical May Day In A Certain Midwiestern City The Equation Of The 1 (38.39 KiB) Viewed 39 times
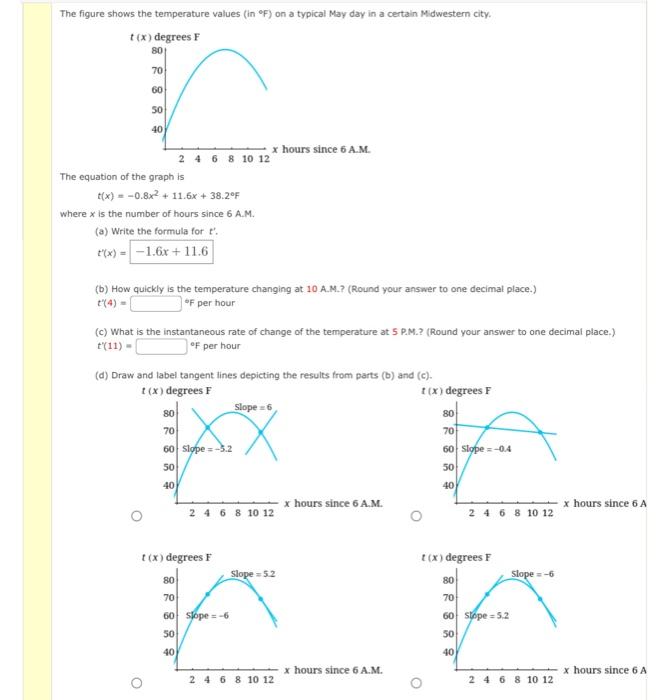
The figure shows the temperature values (in ∘F) on a typical May day in a certain Midwiestern city. The equation of the graph is t(x)=−0.8x2+11.6x+38.2∘F where x is the number of hours since 6 A.M. (a) Write the formula for t′. t′(x)= (b) How quickly is the temperature changing at 10 A.M.? (Round your answer to one decimal place.) t′(4)= of per hour