Page 1 of 1
From the figure shown, 1. Draw a load line using the characteristic curve and the circuit shown above with the output eq
Posted: Thu Jul 14, 2022 2:37 pm
by answerhappygod
- From The Figure Shown 1 Draw A Load Line Using The Characteristic Curve And The Circuit Shown Above With The Output Eq 1 (56.93 KiB) Viewed 45 times
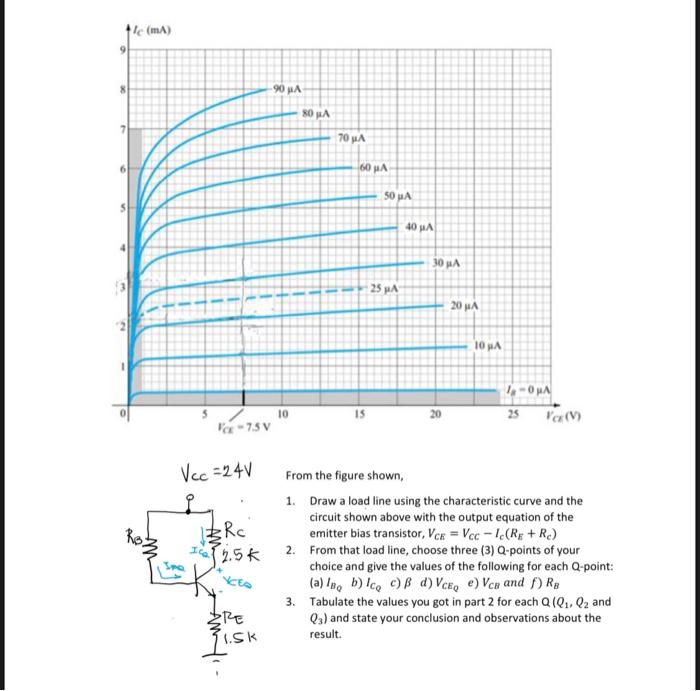
From the figure shown, 1. Draw a load line using the characteristic curve and the circuit shown above with the output equation of the emitter bias transistor, VCE=VCC−IC(RE+RC) 2. From that load line, choose three (3) Q-points of your choice and give the values of the following for each Q-point: (a) IBQ b) ICQ c) β d) VCEQ e) VCB and f) RB 3. Tabulate the values you got in part 2 for each Q(Q1,Q2 and Q3 ) and state your conclusion and observations about the result.