Page 1 of 1
Figure QJA shows a capacitive interential axial displacement transducer comprising three parallel flat square electrodes
Posted: Tue Apr 26, 2022 2:03 pm
by answerhappygod
- Figure Qja Shows A Capacitive Interential Axial Displacement Transducer Comprising Three Parallel Flat Square Electrodes 1 (455.9 KiB) Viewed 38 times
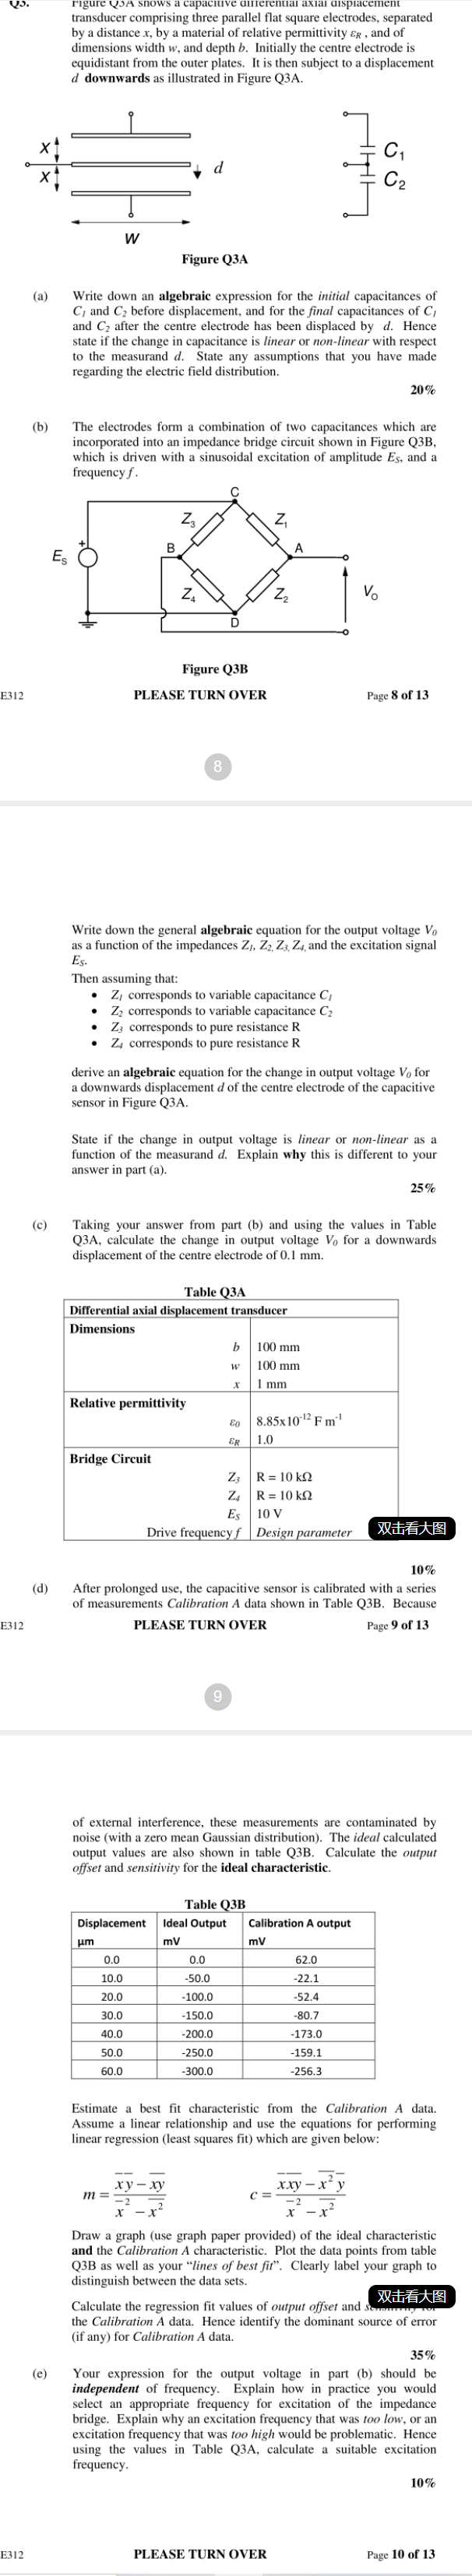
Figure QJA shows a capacitive interential axial displacement transducer comprising three parallel flat square electrodes, separated by a distance x, by a material of relative permittivity r , and of dimensions width w, and depth b. Initially the centre electrode is equidistant from the outer plates. It is then subject to a displacement d downwards as illustrated in Figure Q3A. d C C2 w Figure Q3A (a) Write down an algebraic expression for the initial capacitances of C and C2 before displacement, and for the final capacitances of C and C after the centre electrode has been displaced by d. Hence state if the change in capacitance is linear or non-linear with respect to the measurand d. State any assumptions that you have made regarding the electric field distribution. 20% (b) The electrodes form a combination of two capacitances which are incorporated into an impedance bridge circuit shown in Figure Q3B, which is driven with a sinusoidal excitation of amplitude Es, and a frequency f. Z3 Z B A Es Z Vo D Figure 3B E312 PLEASE TURN OVER Page 8 of 13 8 Write down the general algebraic equation for the output voltage Vo as a function of the impedances Z1, Z2, Z3, Z4 and the excitation signal Es. Then assuming that: Z corresponds to variable capacitance C • Z2 corresponds to variable capacitance C2 • Z3 corresponds to pure resistance R Z4 corresponds to pure resistance R derive an algebraic equation for the change in output voltage V, for a downwards displacement d of the centre electrode of the capacitive sensor in Figure Q3A. State if the change in output voltage is linear or non-linear as a function of the measurand d. Explain why this is different to your answer in part (a). 25% (c) Taking your answer from part (b) and using the values in Table Q3A, calculate the change in output voltage V. for a downwards displacement of the centre electrode of 0.1 mm. W x Table Q3A Differential axial displacement transducer Dimensions b 100 mm 100 mm 1 mm Relative permittivity 8.85x 10⁻¹² Fm 1.0 Bridge Circuit Zz R = 10 k22 Z4 R = 10 k 2 ES Drive frequencyf Design parameter Eo ER 10 V 双击看大图 (d) 10% After prolonged use, the capacitive sensor is calibrated with a series of measurements Calibration A data shown in Table Q3B. Because PLEASE TURN OVER E312 Page 9 of 13 9 of external interference, these measurements are contaminated by noise (with a zero mean Gaussian distribution). The ideal calculated output values are also shown in table Q3B. Calculate the output offset and sensitivity for the ideal characteristic. Displacement im 0.0 Table Q3B Ideal Output Calibration A output mV mV 0.0 62.0 -50.0 -22.1 10.0 -100.0 20.0 30.0 -150.0 -52.4 -80.7 -173.0 40.0 -200.0 50.0 -250.0 -159.1 60.0 -300.0 -256.3 Estimate a best fit characteristic from the Calibration A data. Assume a linear relationship and use the equations for performing linear regression (least squares fit) which are given below: xy - xy m = X xxy-xy C= x Draw a graph (use graph paper provided) of the ideal characteristic and the Calibration A characteristic. Plot the data points from table Q3B as well as your "lines of best fit". Clearly label your graph to distinguish between the data sets. 双击看大图 Calculate the regression fit values of output offset and som the Calibration A data. Hence identify the dominant source of error (if any) for Calibration A data. 35% Your expression for the output voltage in part (b) should be independent of frequency. Explain how in practice you would select an appropriate frequency for excitation of the impedance bridge. Explain why an excitation frequency that was too low, or an excitation frequency that was too high would be problematic. Hence using the values in Table Q3A, calculate a suitable excitation frequency. 10% (e) E312 PLEASE TURN OVER Page 10 of 13